Who needs this
- ML engineers shipping models to staging and production clusters
- LLM teams running on-prem inference with governance requirements
- Tech leads bridging data science notebooks and platform standards
Industries
AI & ML engineering, MLOps, data platform, cloud-native startup, and internal developer platform teams shipping on their own terms.
Industry · AI & ML engineering
LLM, GPU, and Kubernetes workloads in one engineering control plane
Model builders need GPU visibility, sane deploy paths, and the same cluster context as platform—not a separate “AI portal” that drifts from production. FusioNative keeps LLM deploy wizards, inference KPIs, and pod-level workloads in one navigation model.
Design, deploy, and observe LLMs and training workloads on Kubernetes with GPU metrics beside the pods they run on.
Product screens with notes on when each view matters for your sector.
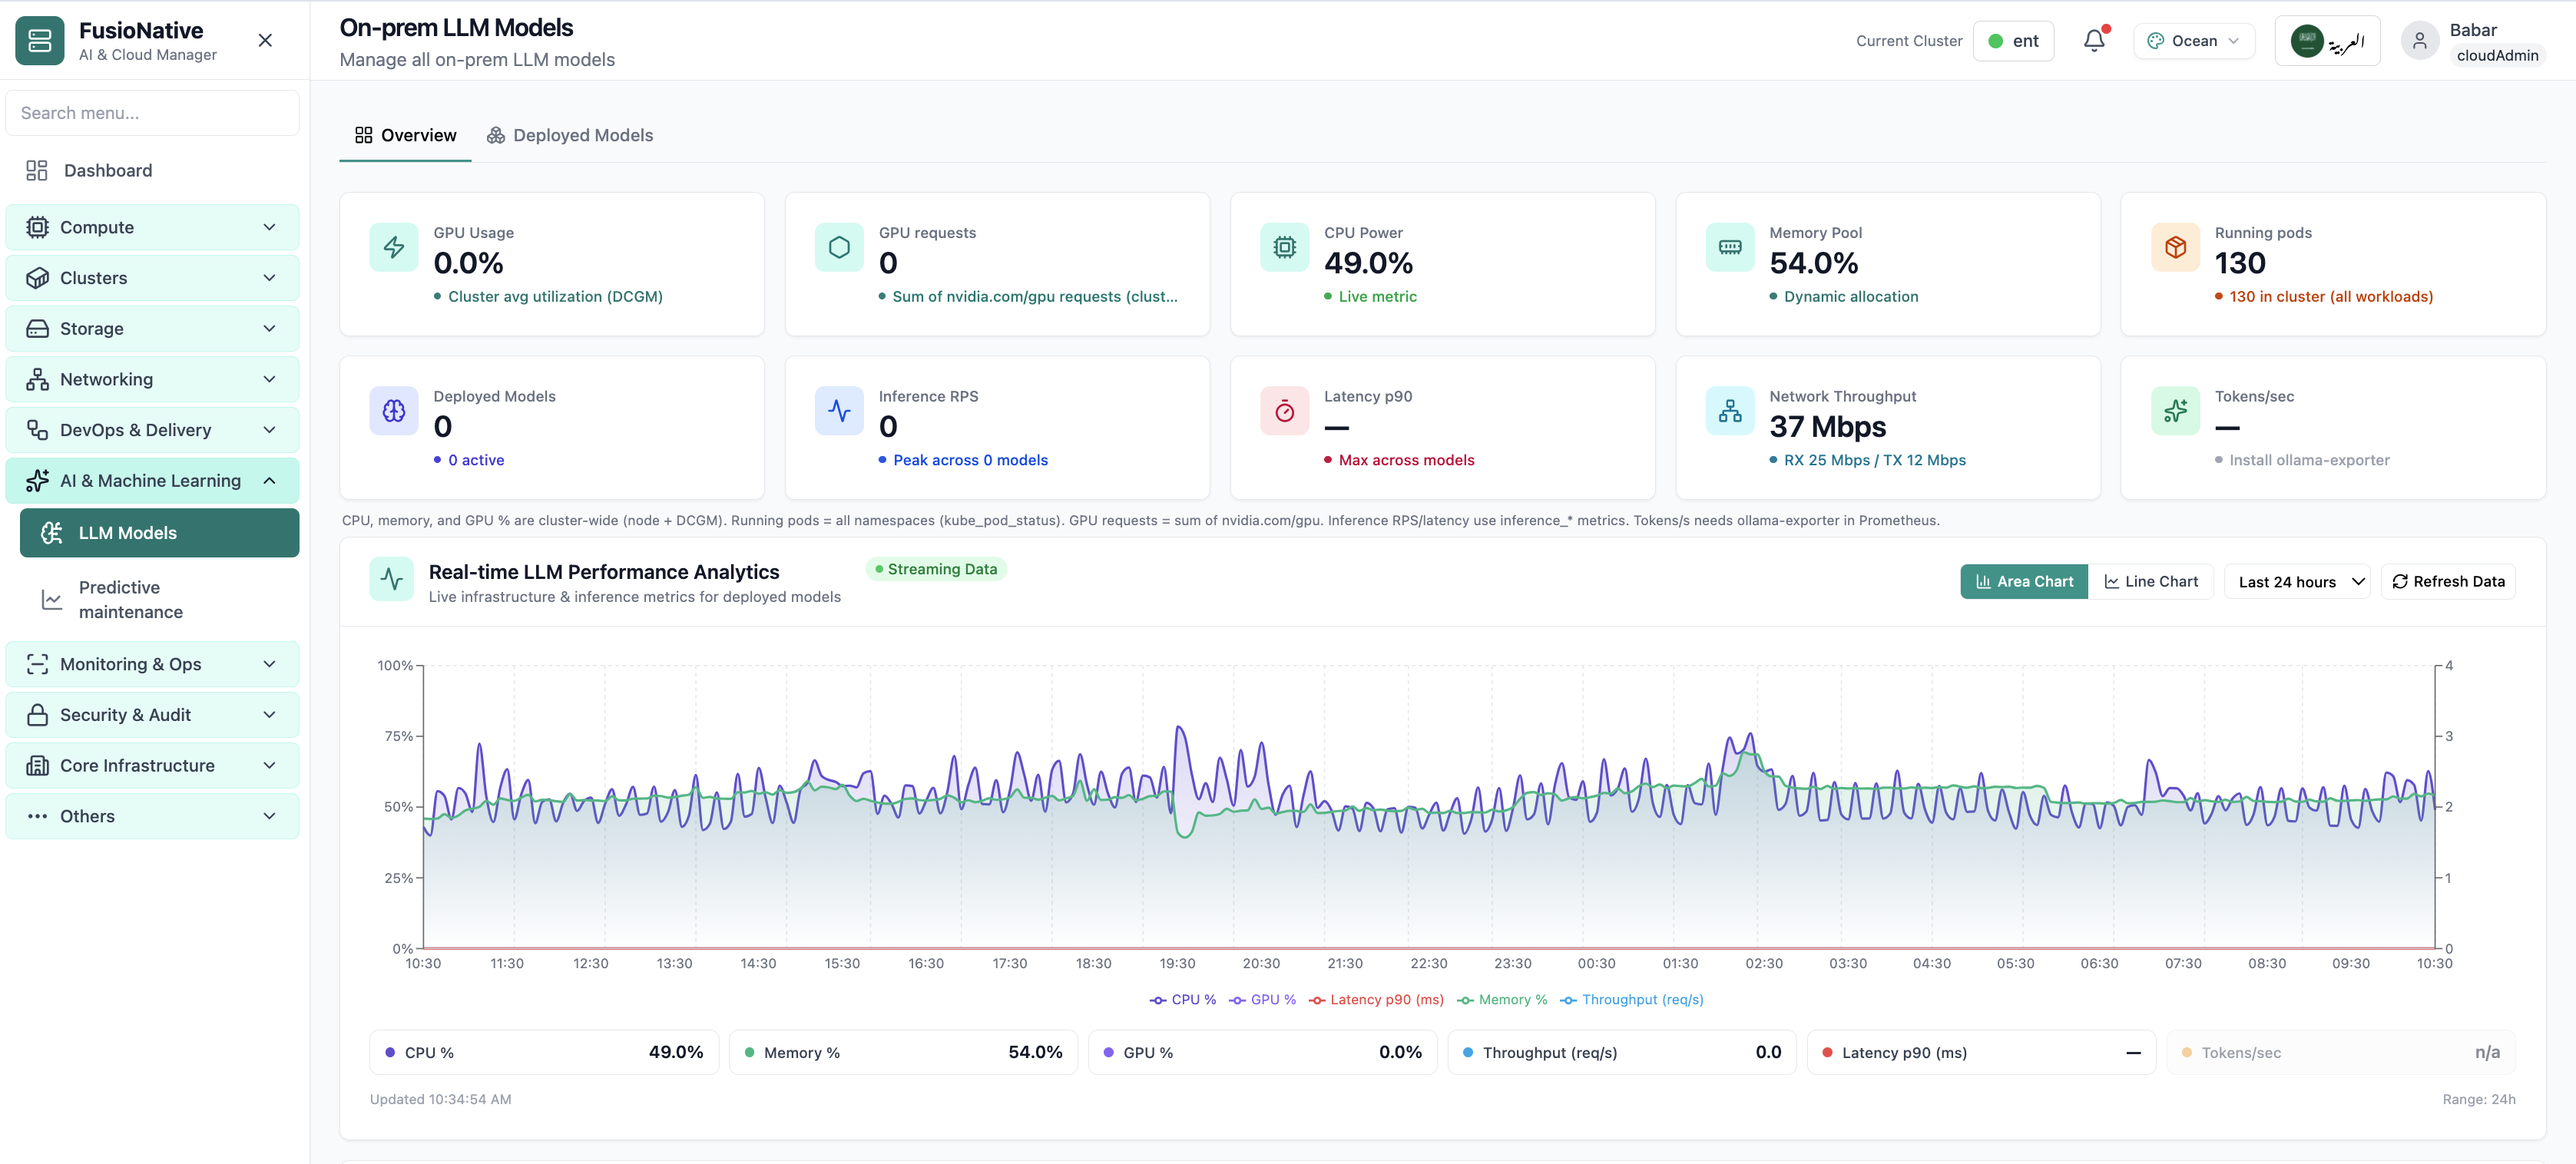
Model KPIs and GPU signals on one overview—where ML leads start stand-ups.
Click the screenshot to open full size, zoom, and pan.
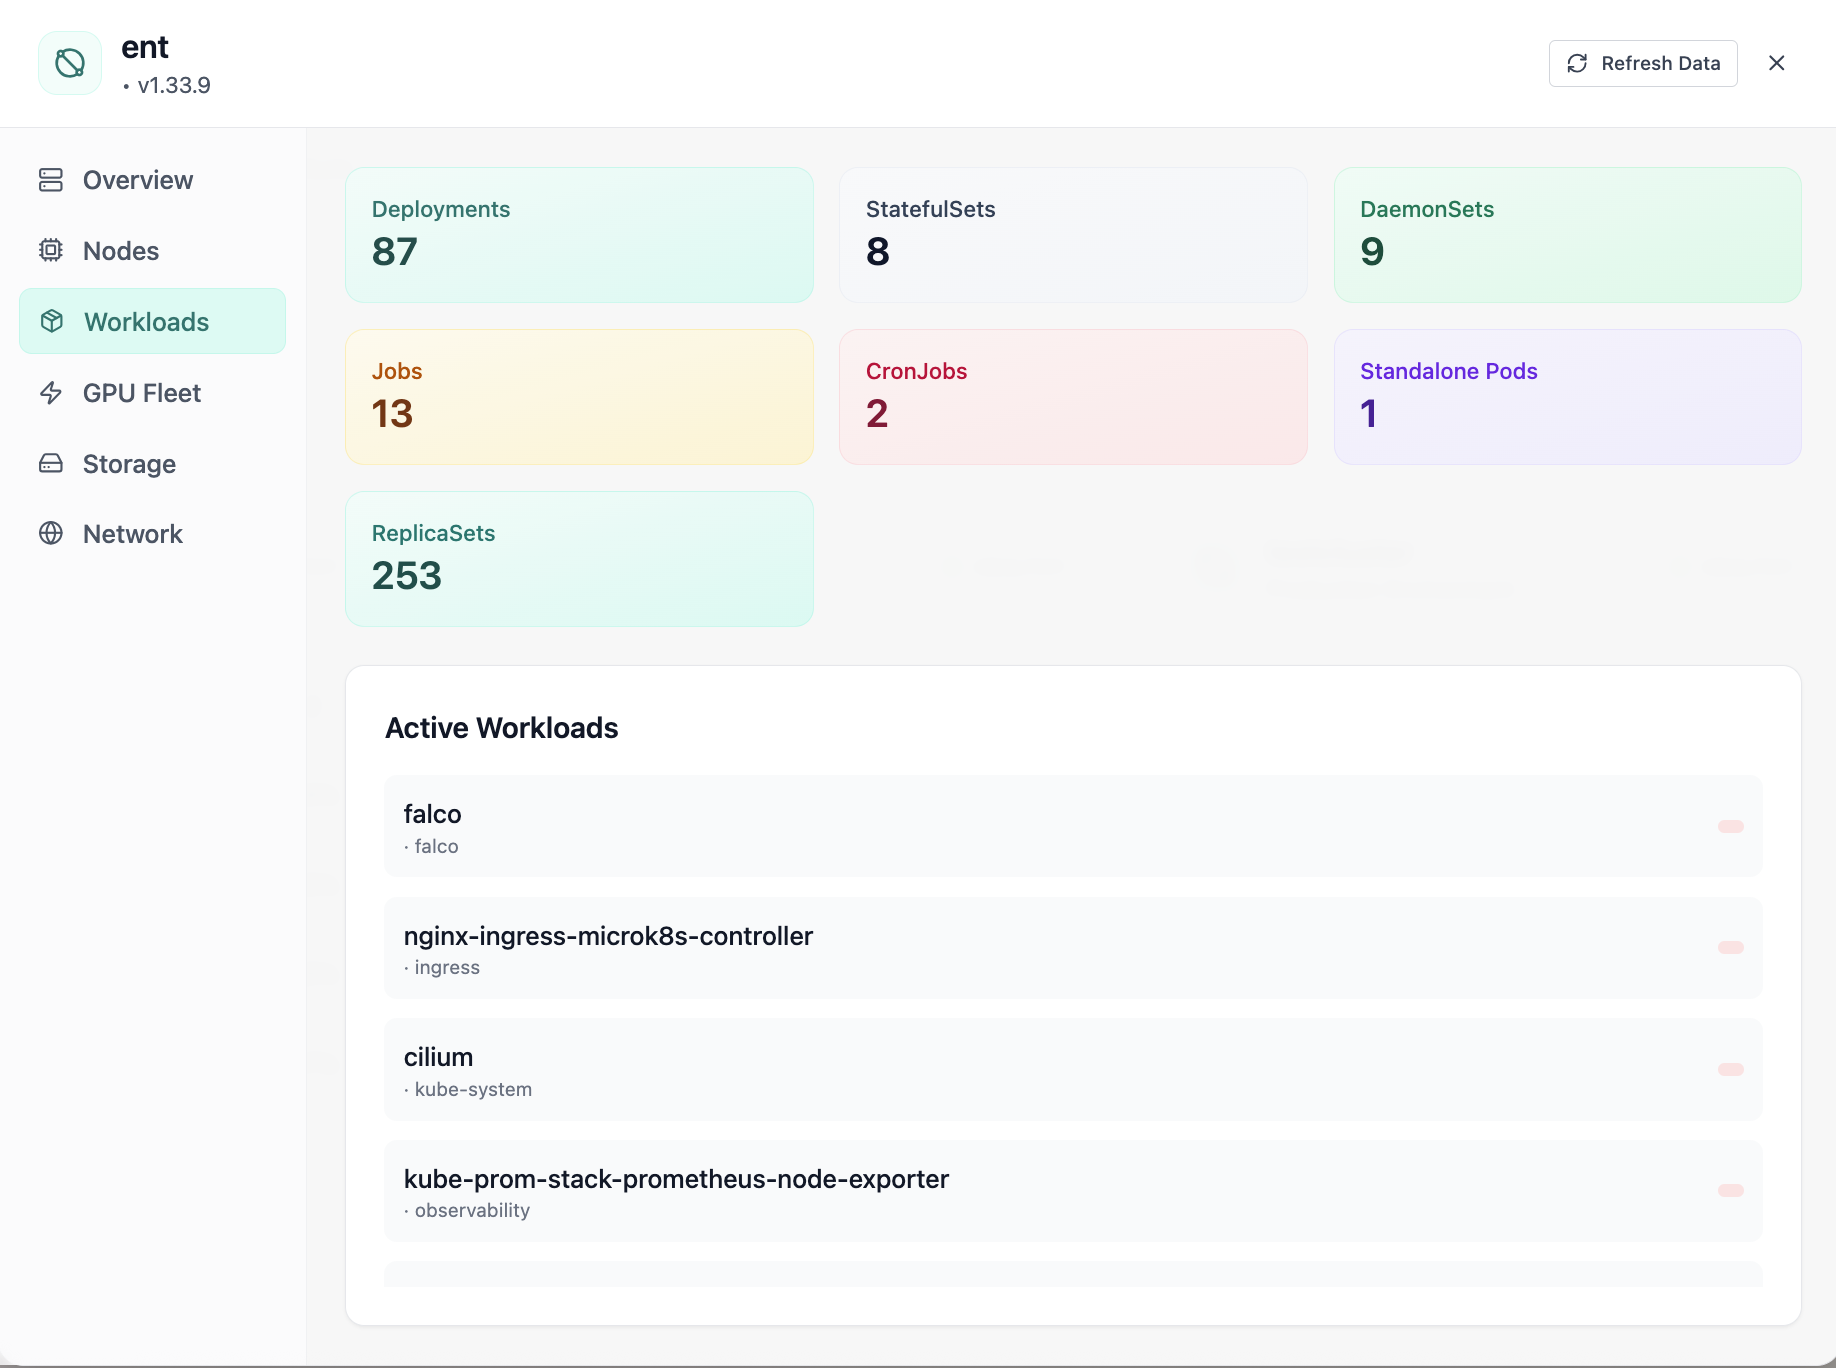
Deployments, StatefulSets, and GPU pods in one inventory—tie models to the objects platform actually runs.
Click the screenshot to open full size, zoom, and pan.
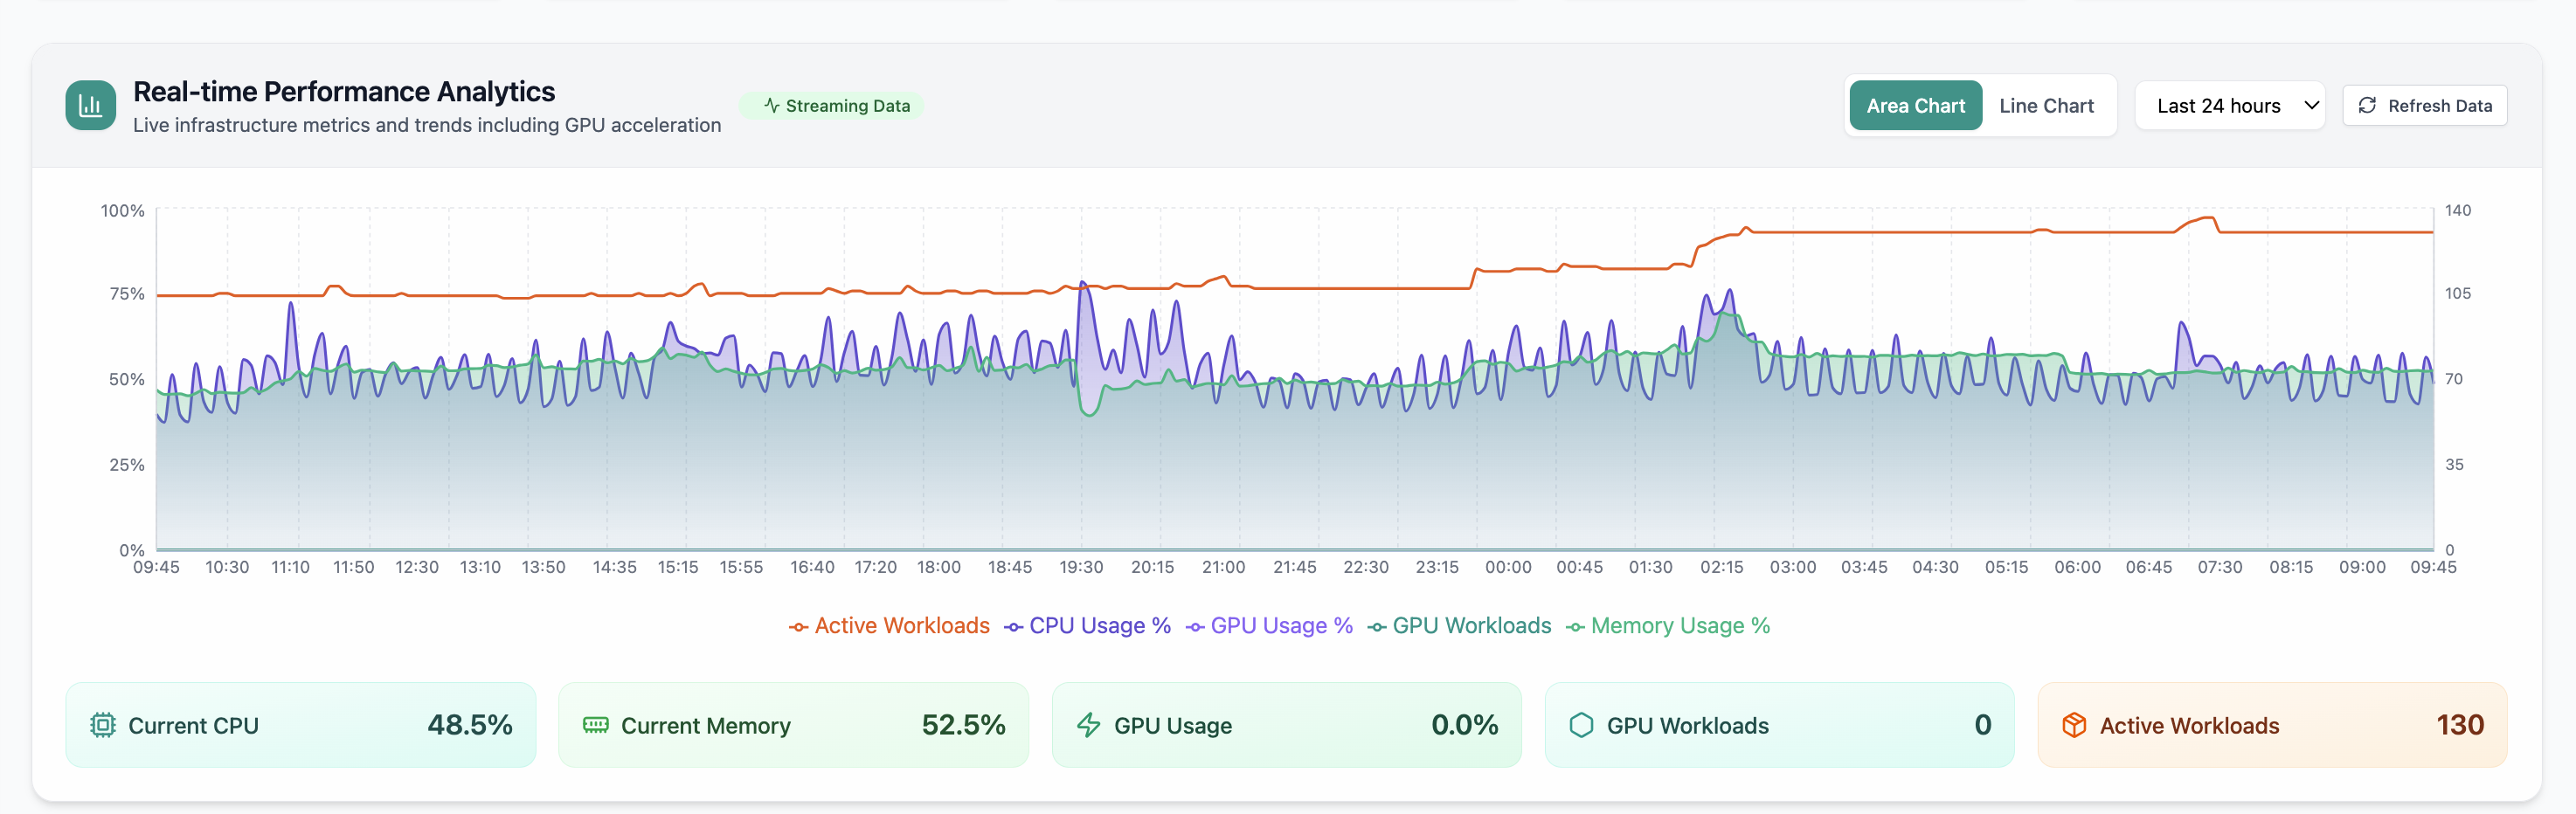
24h CPU, memory, and GPU trends—spot training or inference spikes before they exhaust the pool.
Click the screenshot to open full size, zoom, and pan.
Industry · MLOps
Deploy and monitor models on Kubernetes with guardrails
MLOps sits between ML code and platform reality. FusioNative gives you a repeatable deploy path for models, GPU allocation you can defend in review, and monitoring that speaks both inference and infrastructure.
Take models from artifact to monitored production services with wizard-driven deploys and fleet-grade observability.
Product screens with notes on when each view matters for your sector.
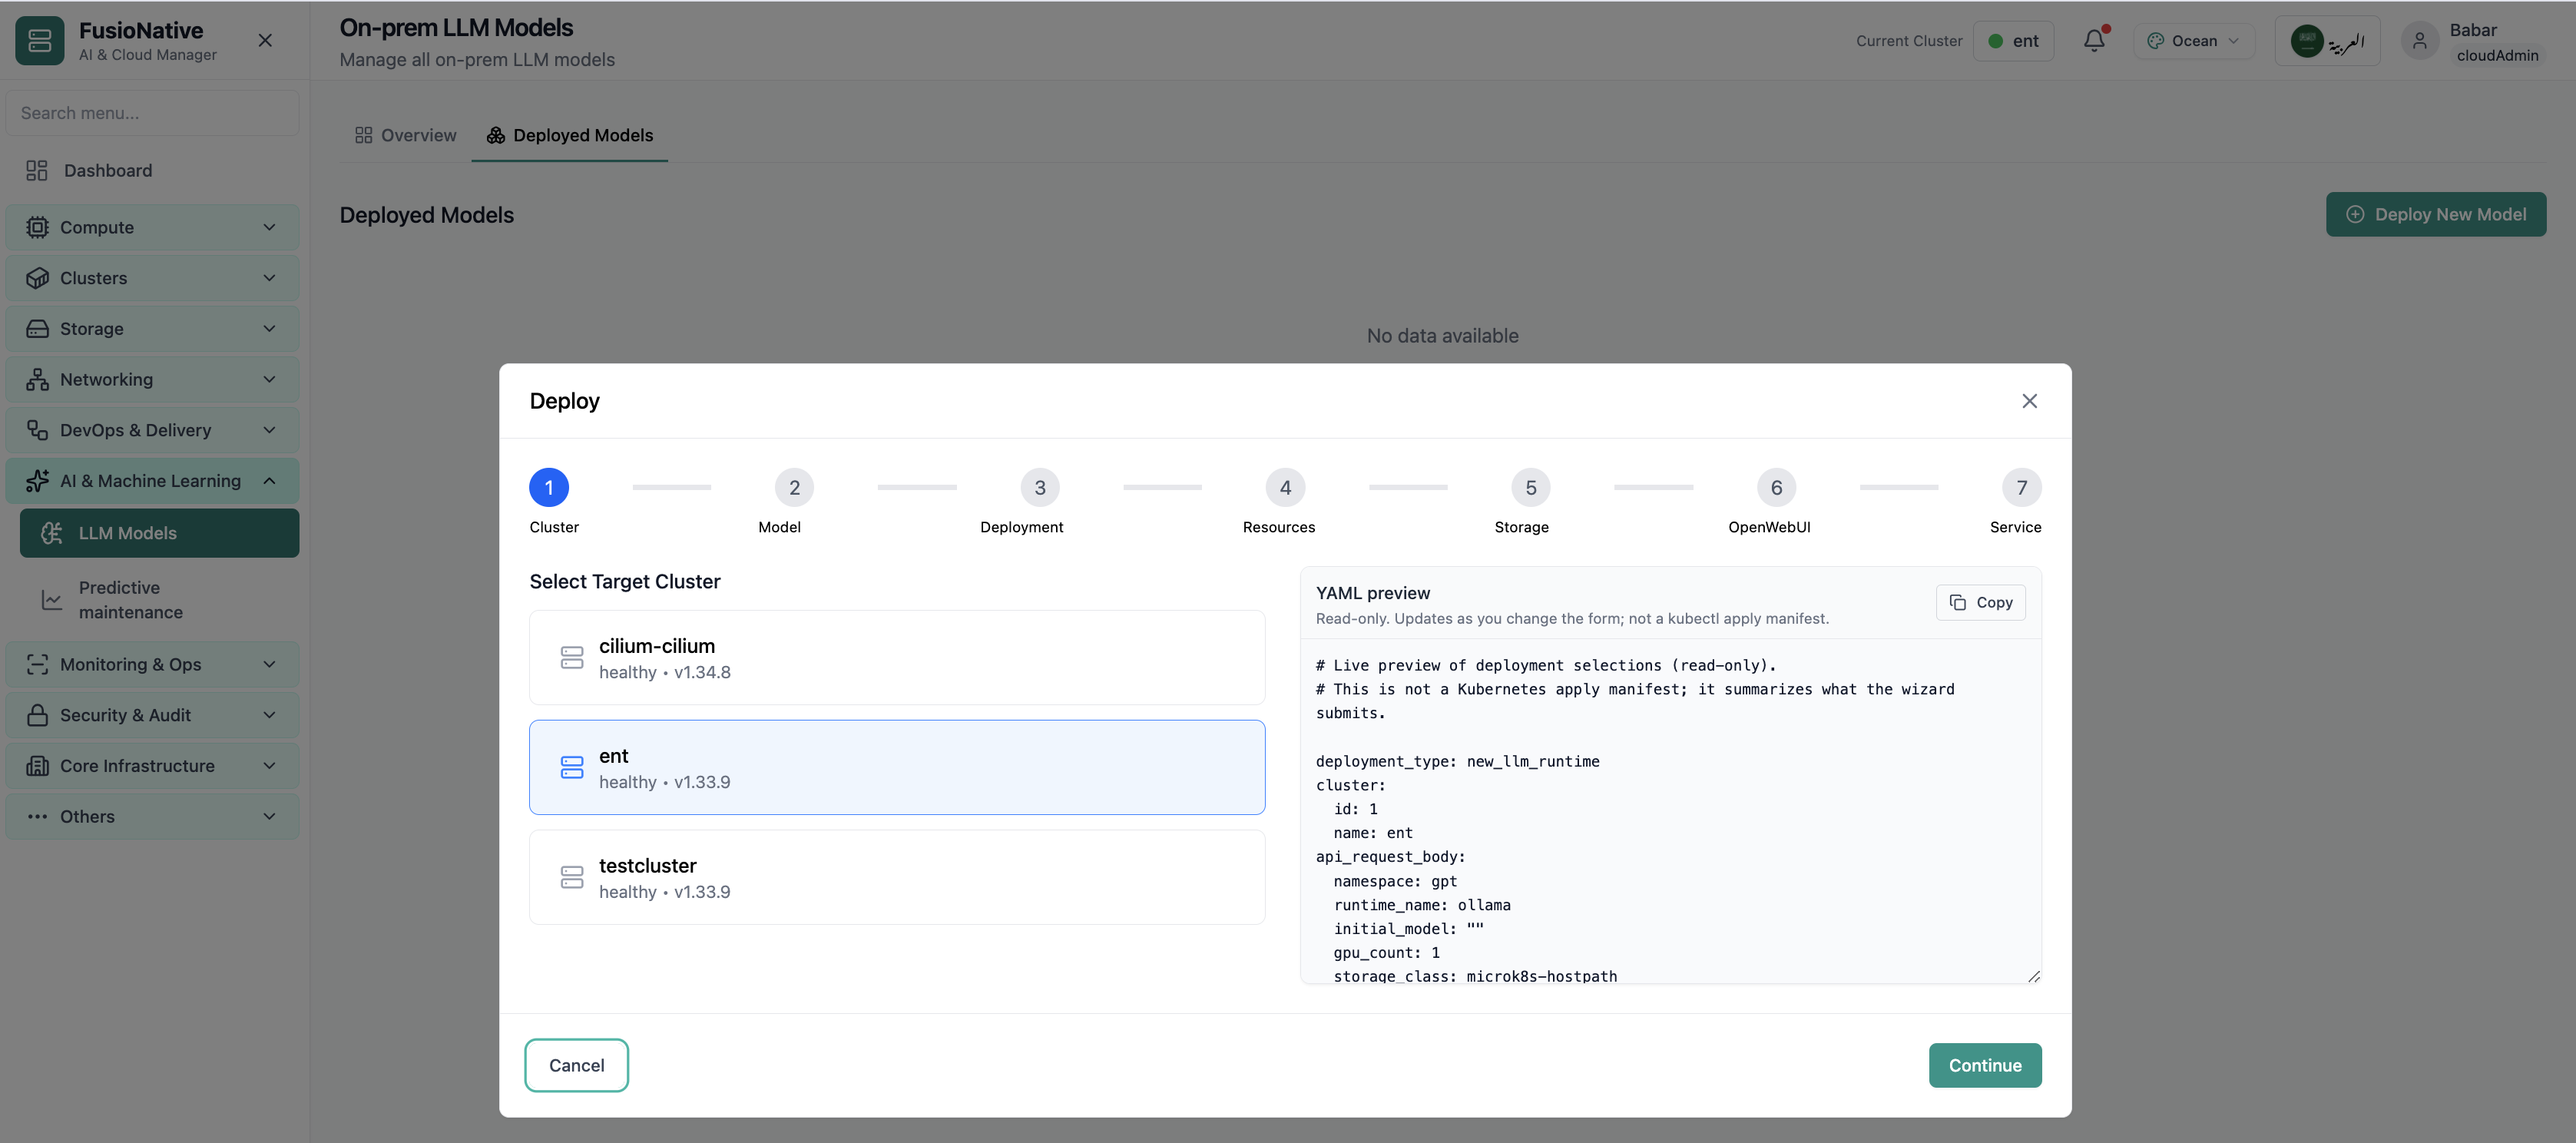
First wizard step—anchor the model to the right cluster and policy boundary.
Click the screenshot to open full size, zoom, and pan.
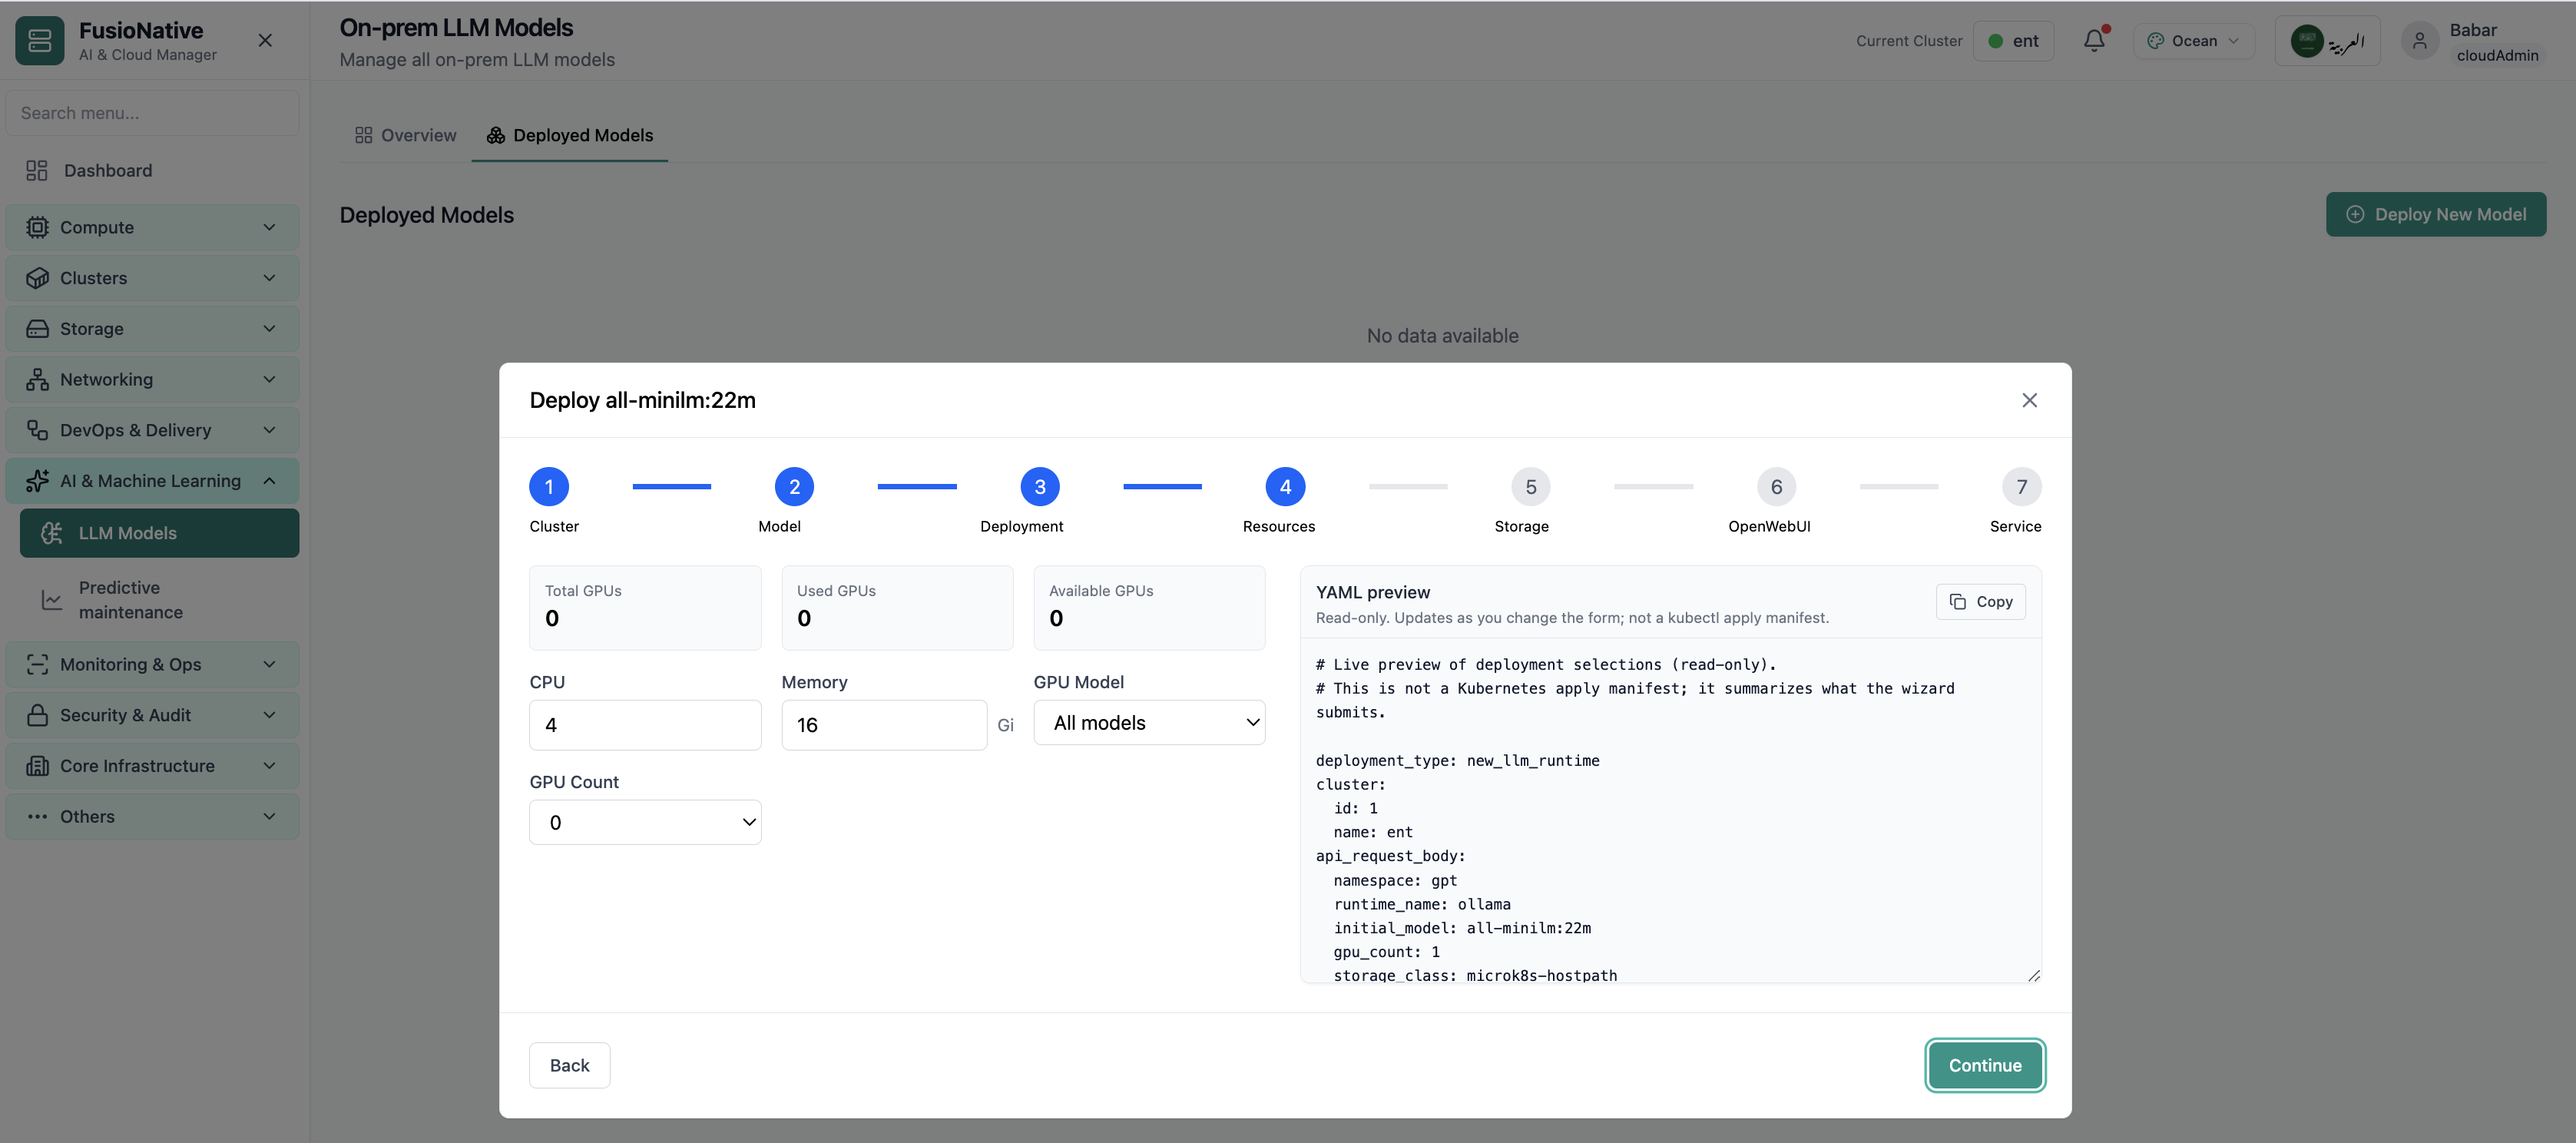
GPU and CPU allocation step—align requests with real pool headroom.
Click the screenshot to open full size, zoom, and pan.
Post-deploy KPIs—operations view after go-live.
Click the screenshot to open full size, zoom, and pan.
Industry · Data platform engineering
Capacity and multi-cluster stacks for data platforms
Data platforms run heavy batch and stream workloads on Kubernetes—often many clusters per region. FusioNative shows capacity, namespace consumption, and fleet health so data infra teams scale before pipelines queue.
Plan headroom and operate multi-cluster data stacks with the same control plane as the rest of engineering.
Product screens with notes on when each view matters for your sector.
Forecasts and headroom—plan nodes before Black Friday-scale batch jobs.
Click the screenshot to open full size, zoom, and pan.
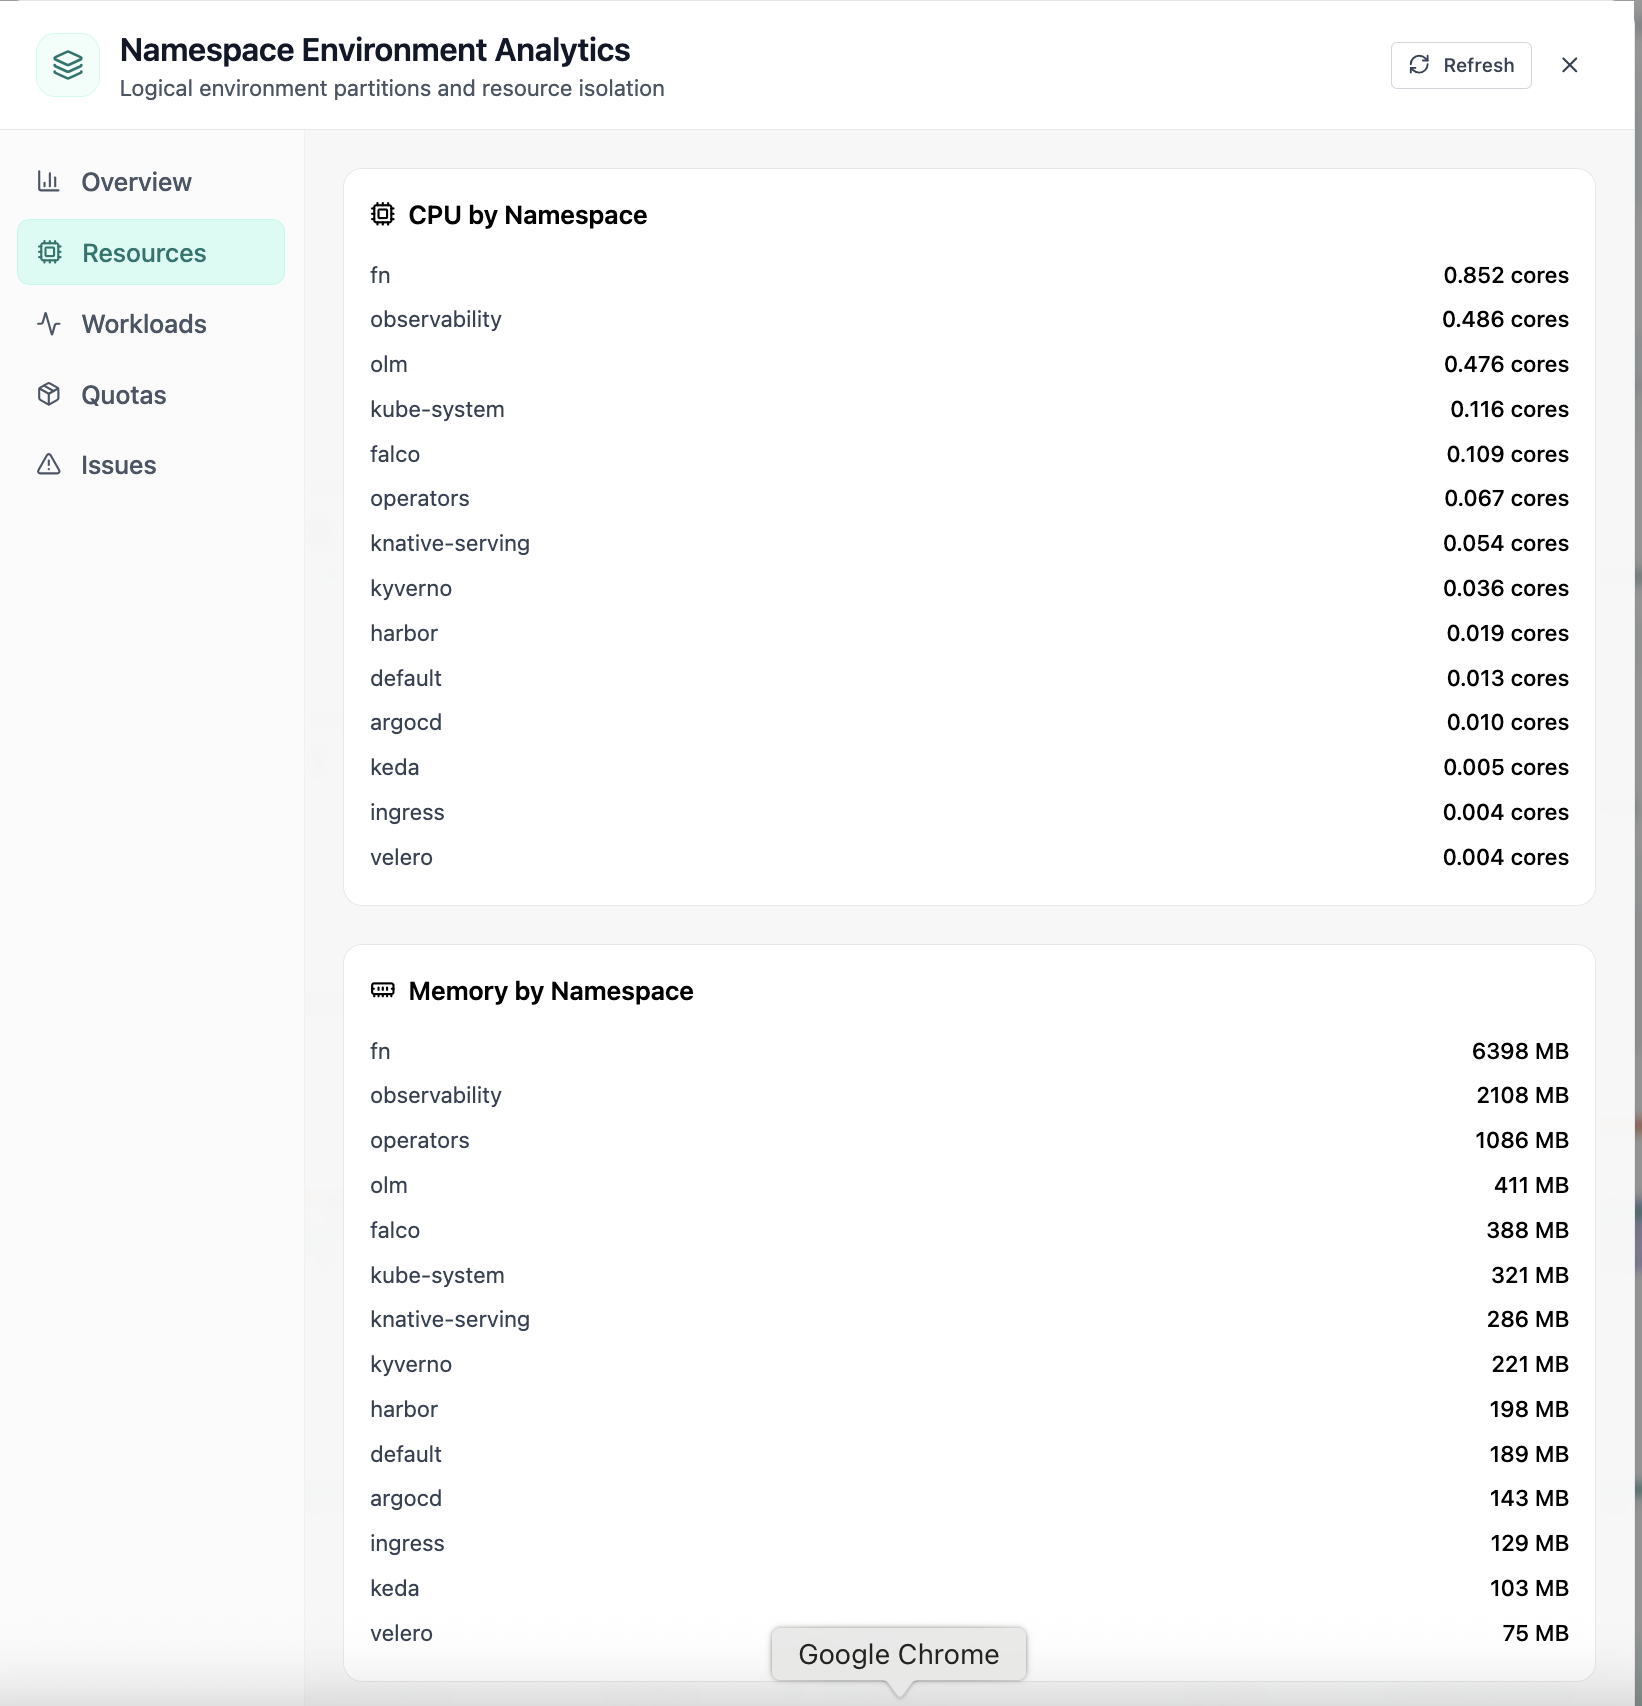
CPU and memory by namespace—identify the job blowing the pool.
Click the screenshot to open full size, zoom, and pan.
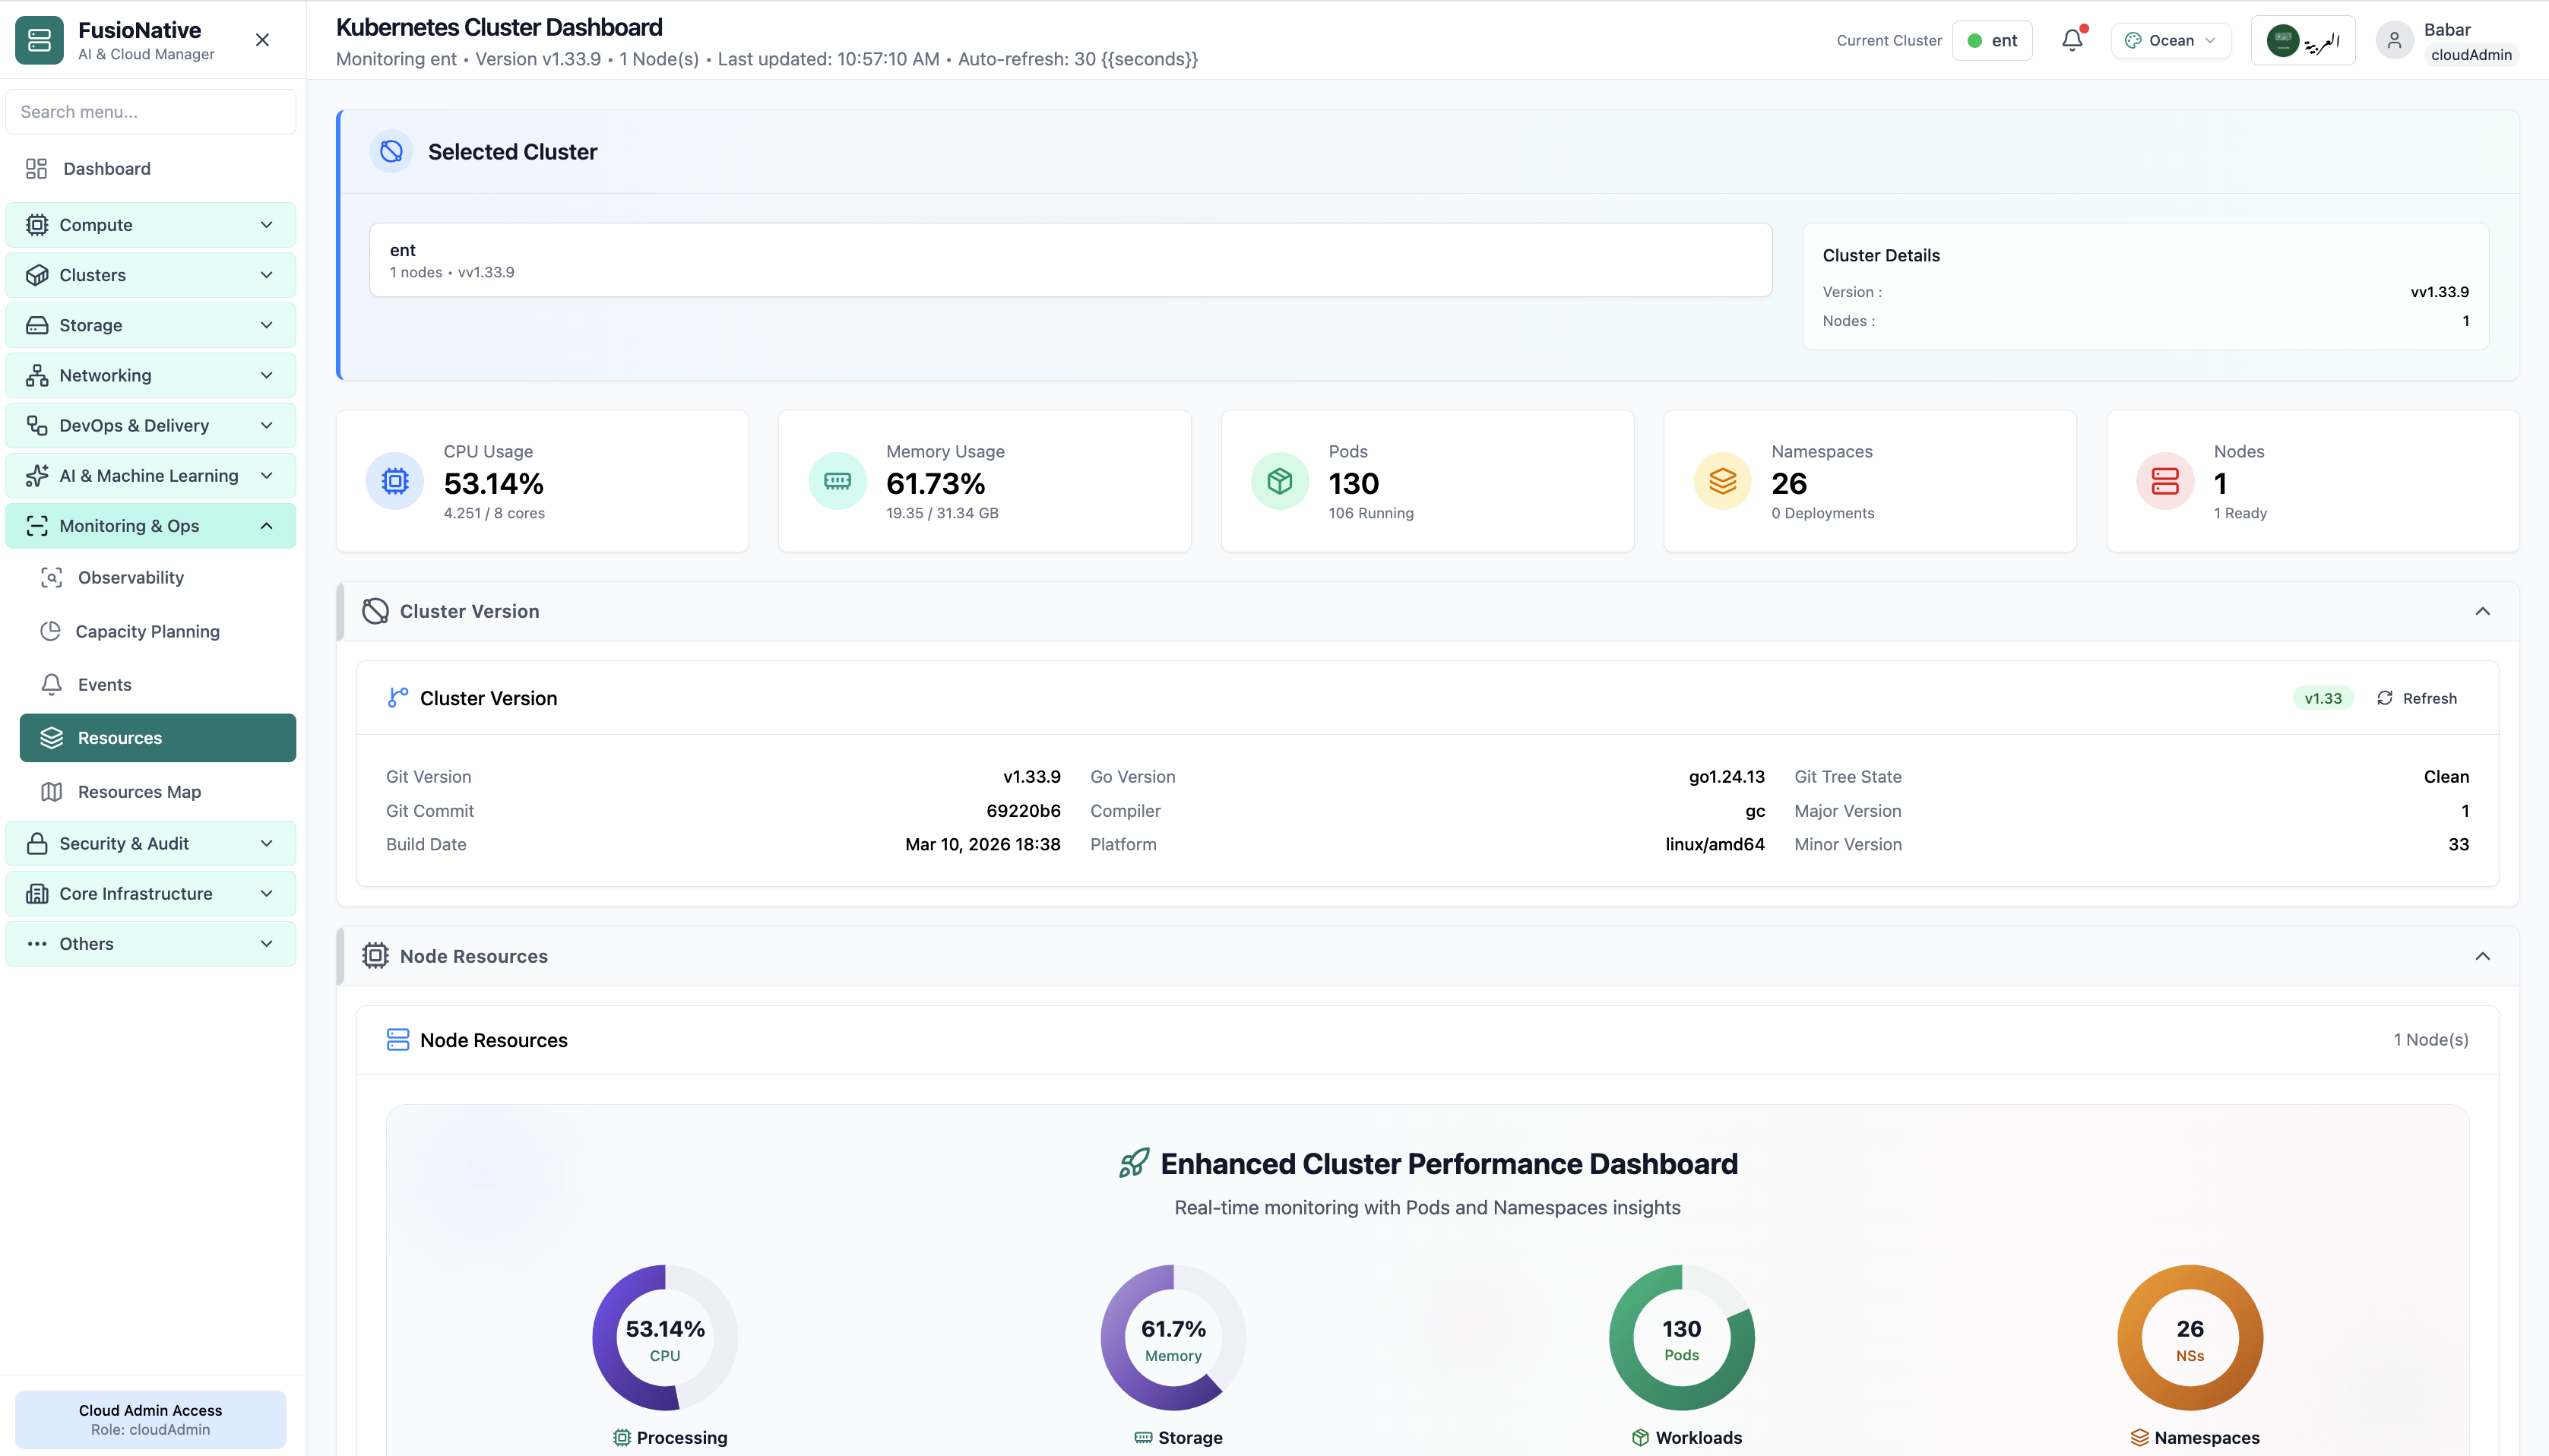
Cluster-level gauges for CPU, memory, pods, and nodes—ops snapshot for data sites.
Click the screenshot to open full size, zoom, and pan.
Industry · Cloud-native startups
Speed, cost visibility, and simple multi-cluster ops
Startups need one operator-friendly plane—not six dashboards held together with scripts. FusioNative gives founders and platform hires fleet visibility, autoscaling, and registry/GitOps basics before headcount scales.
Operate a growing K8s footprint with clear cost signals and provisioning that does not require a 10-person platform team.
Product screens with notes on when each view matters for your sector.
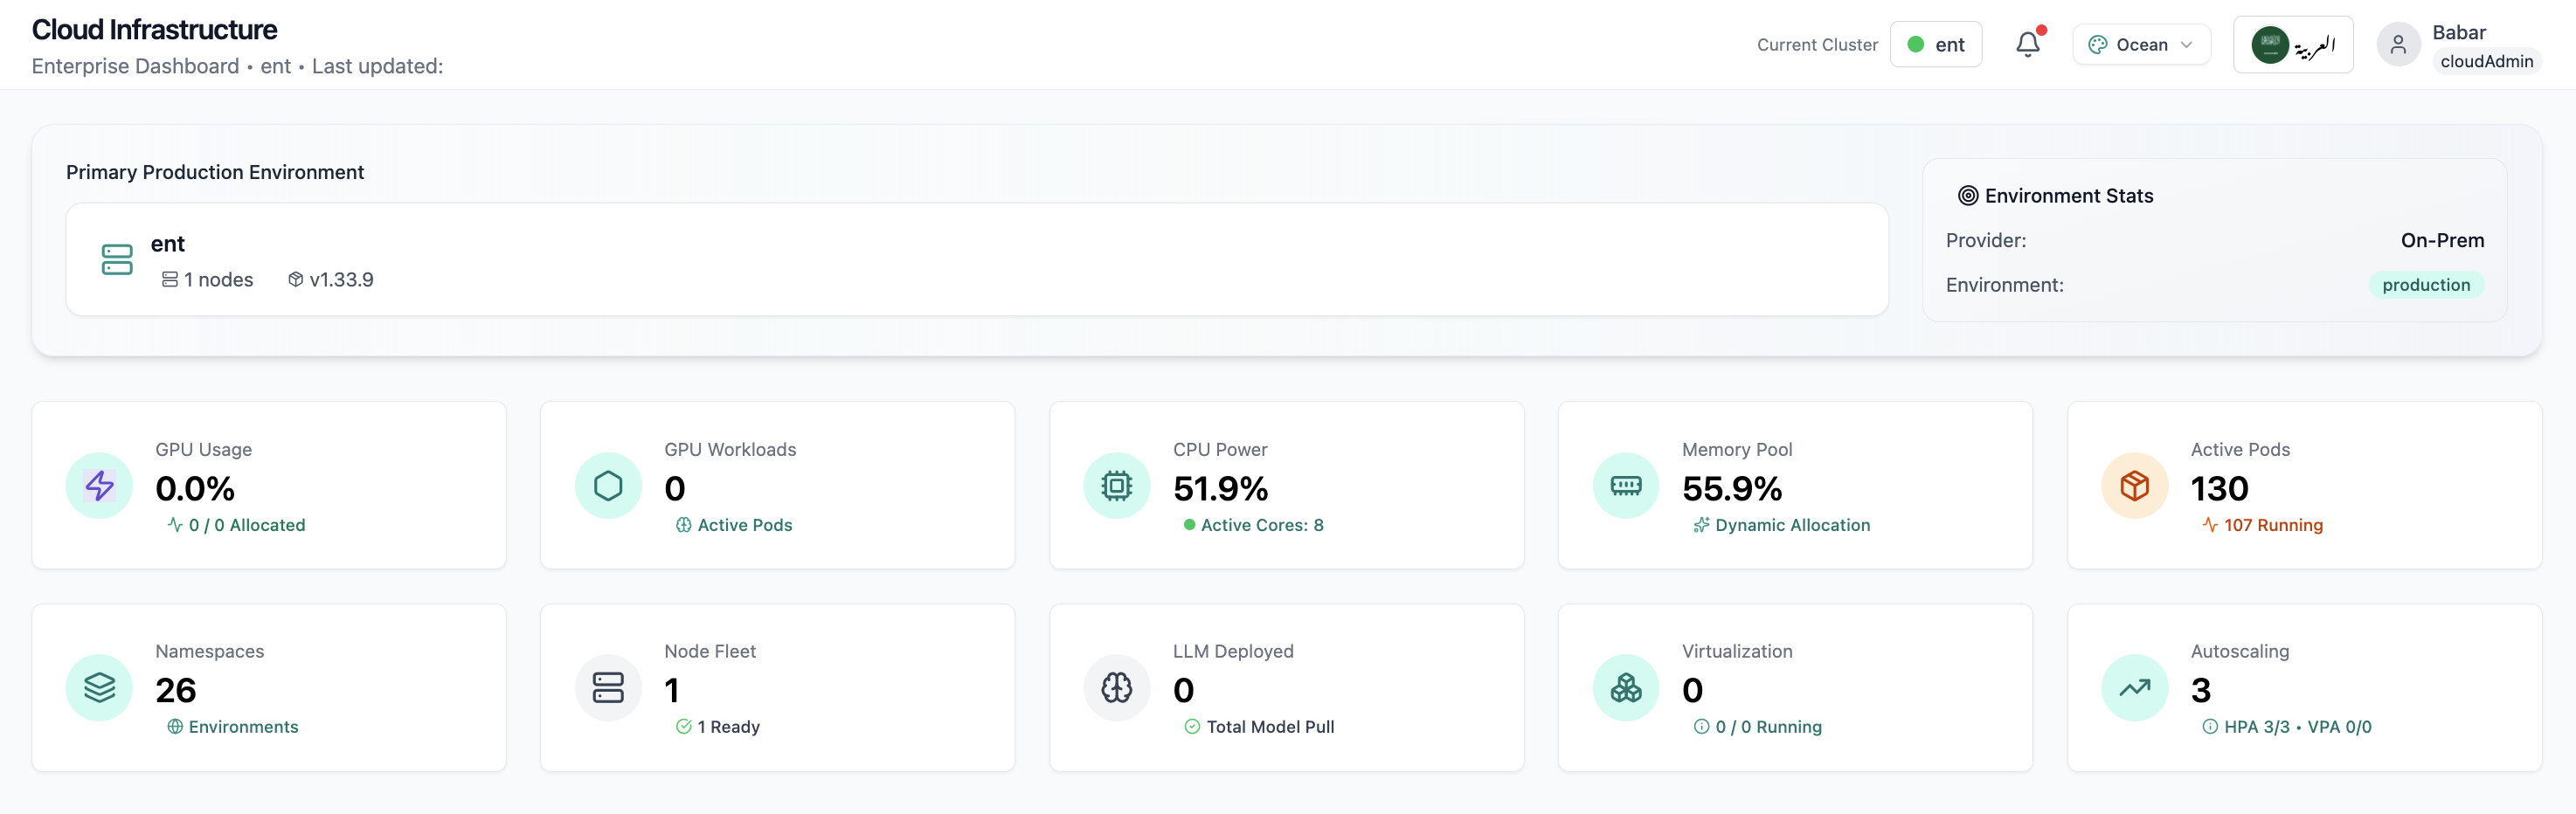
One screen for leadership and engineers—health, GPU, and workloads without a custom Grafana wall.
Click the screenshot to open full size, zoom, and pan.
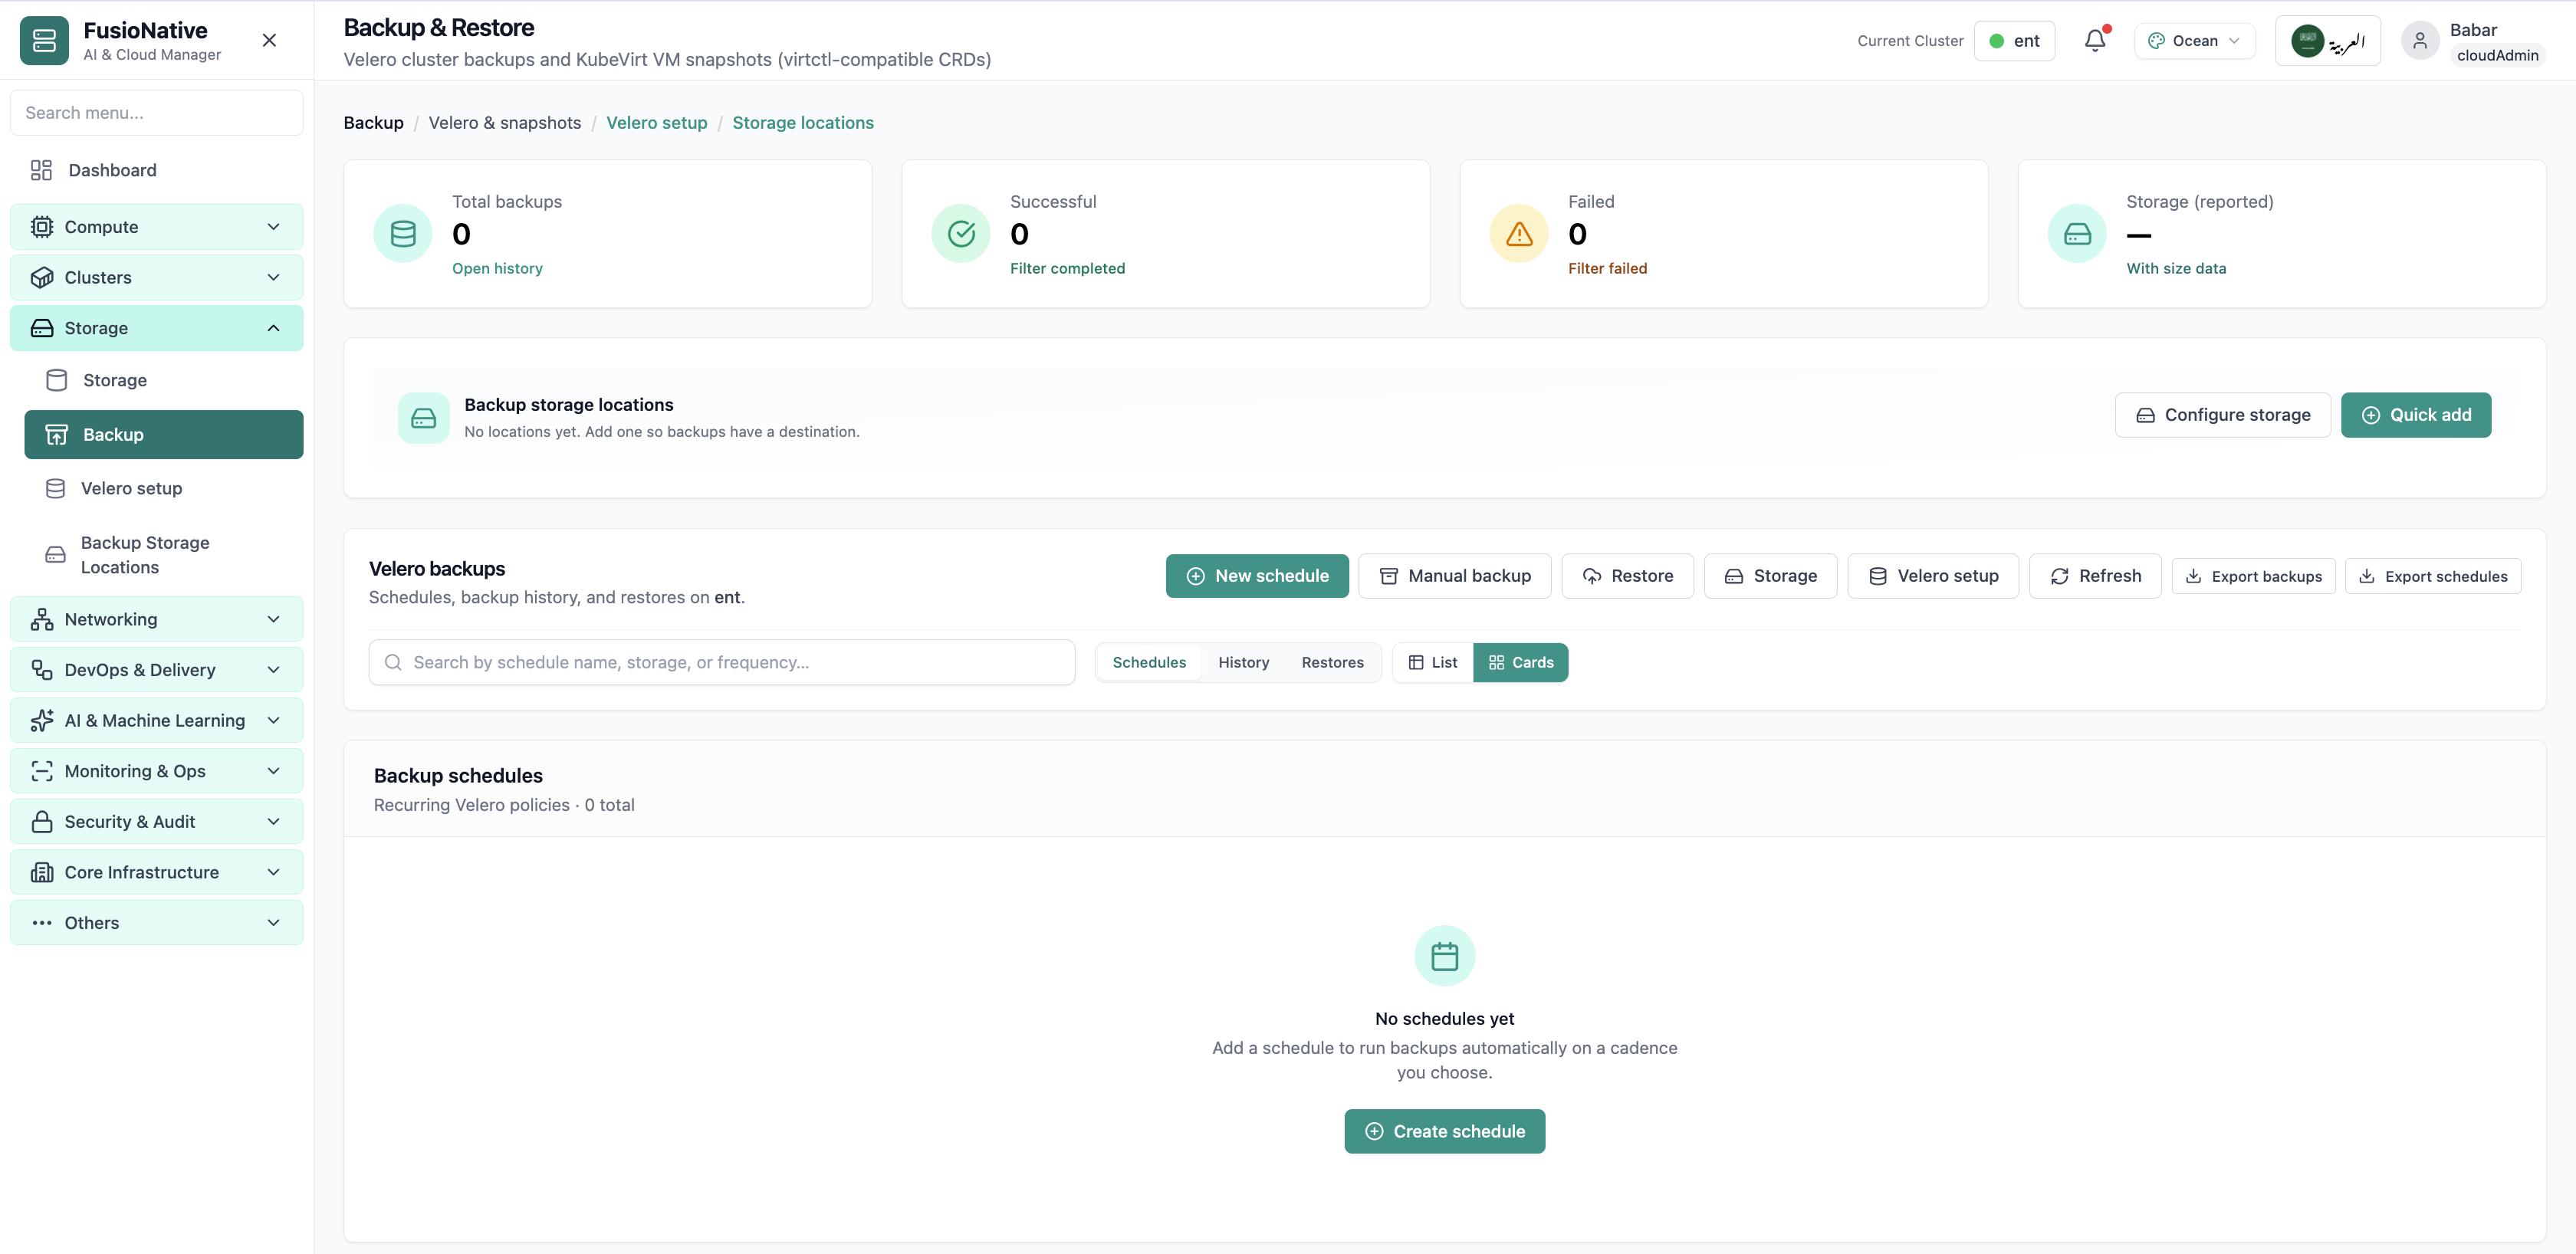
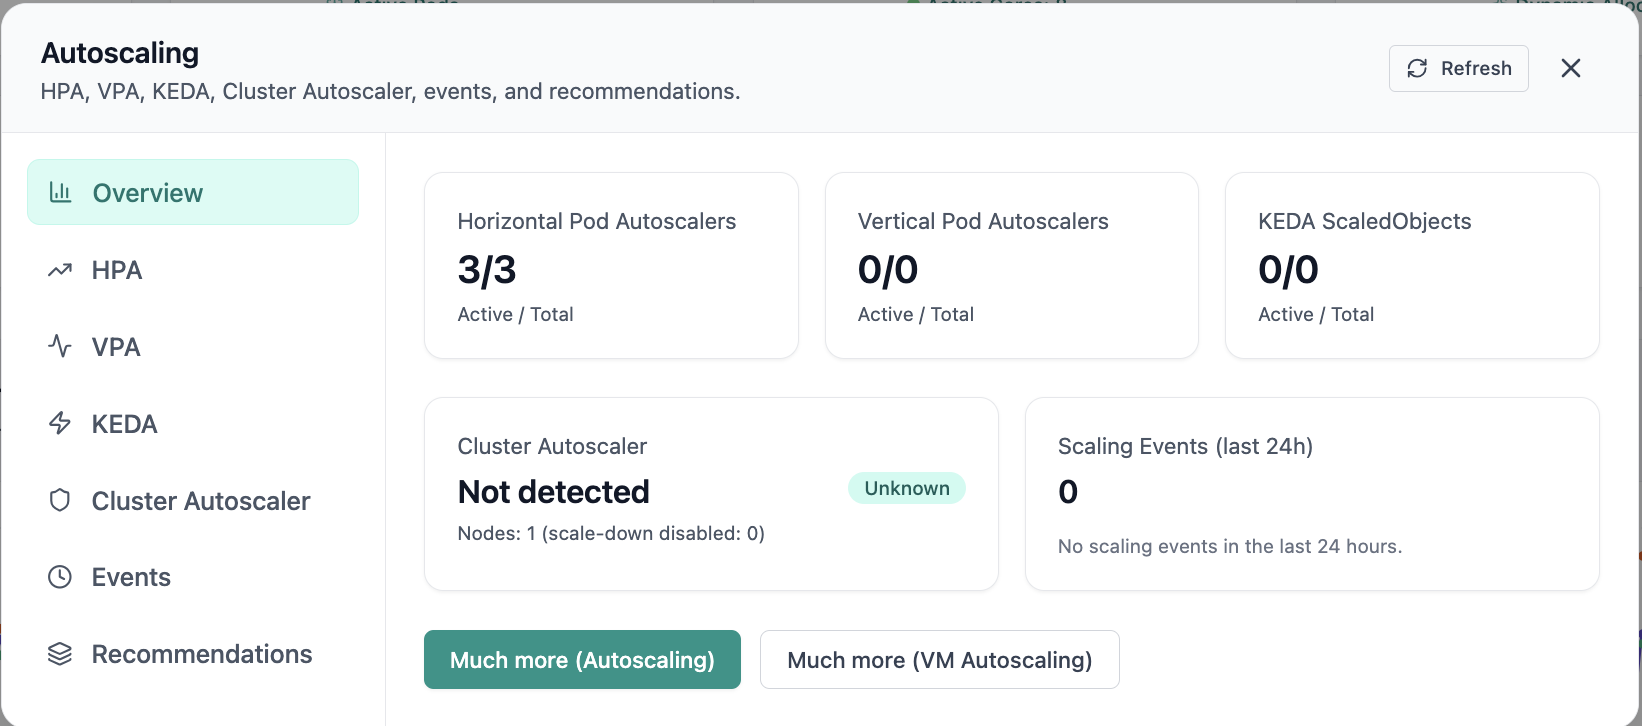
HPA, VPA, and KEDA in one place—grow with traffic without manual node hacks.
Click the screenshot to open full size, zoom, and pan.
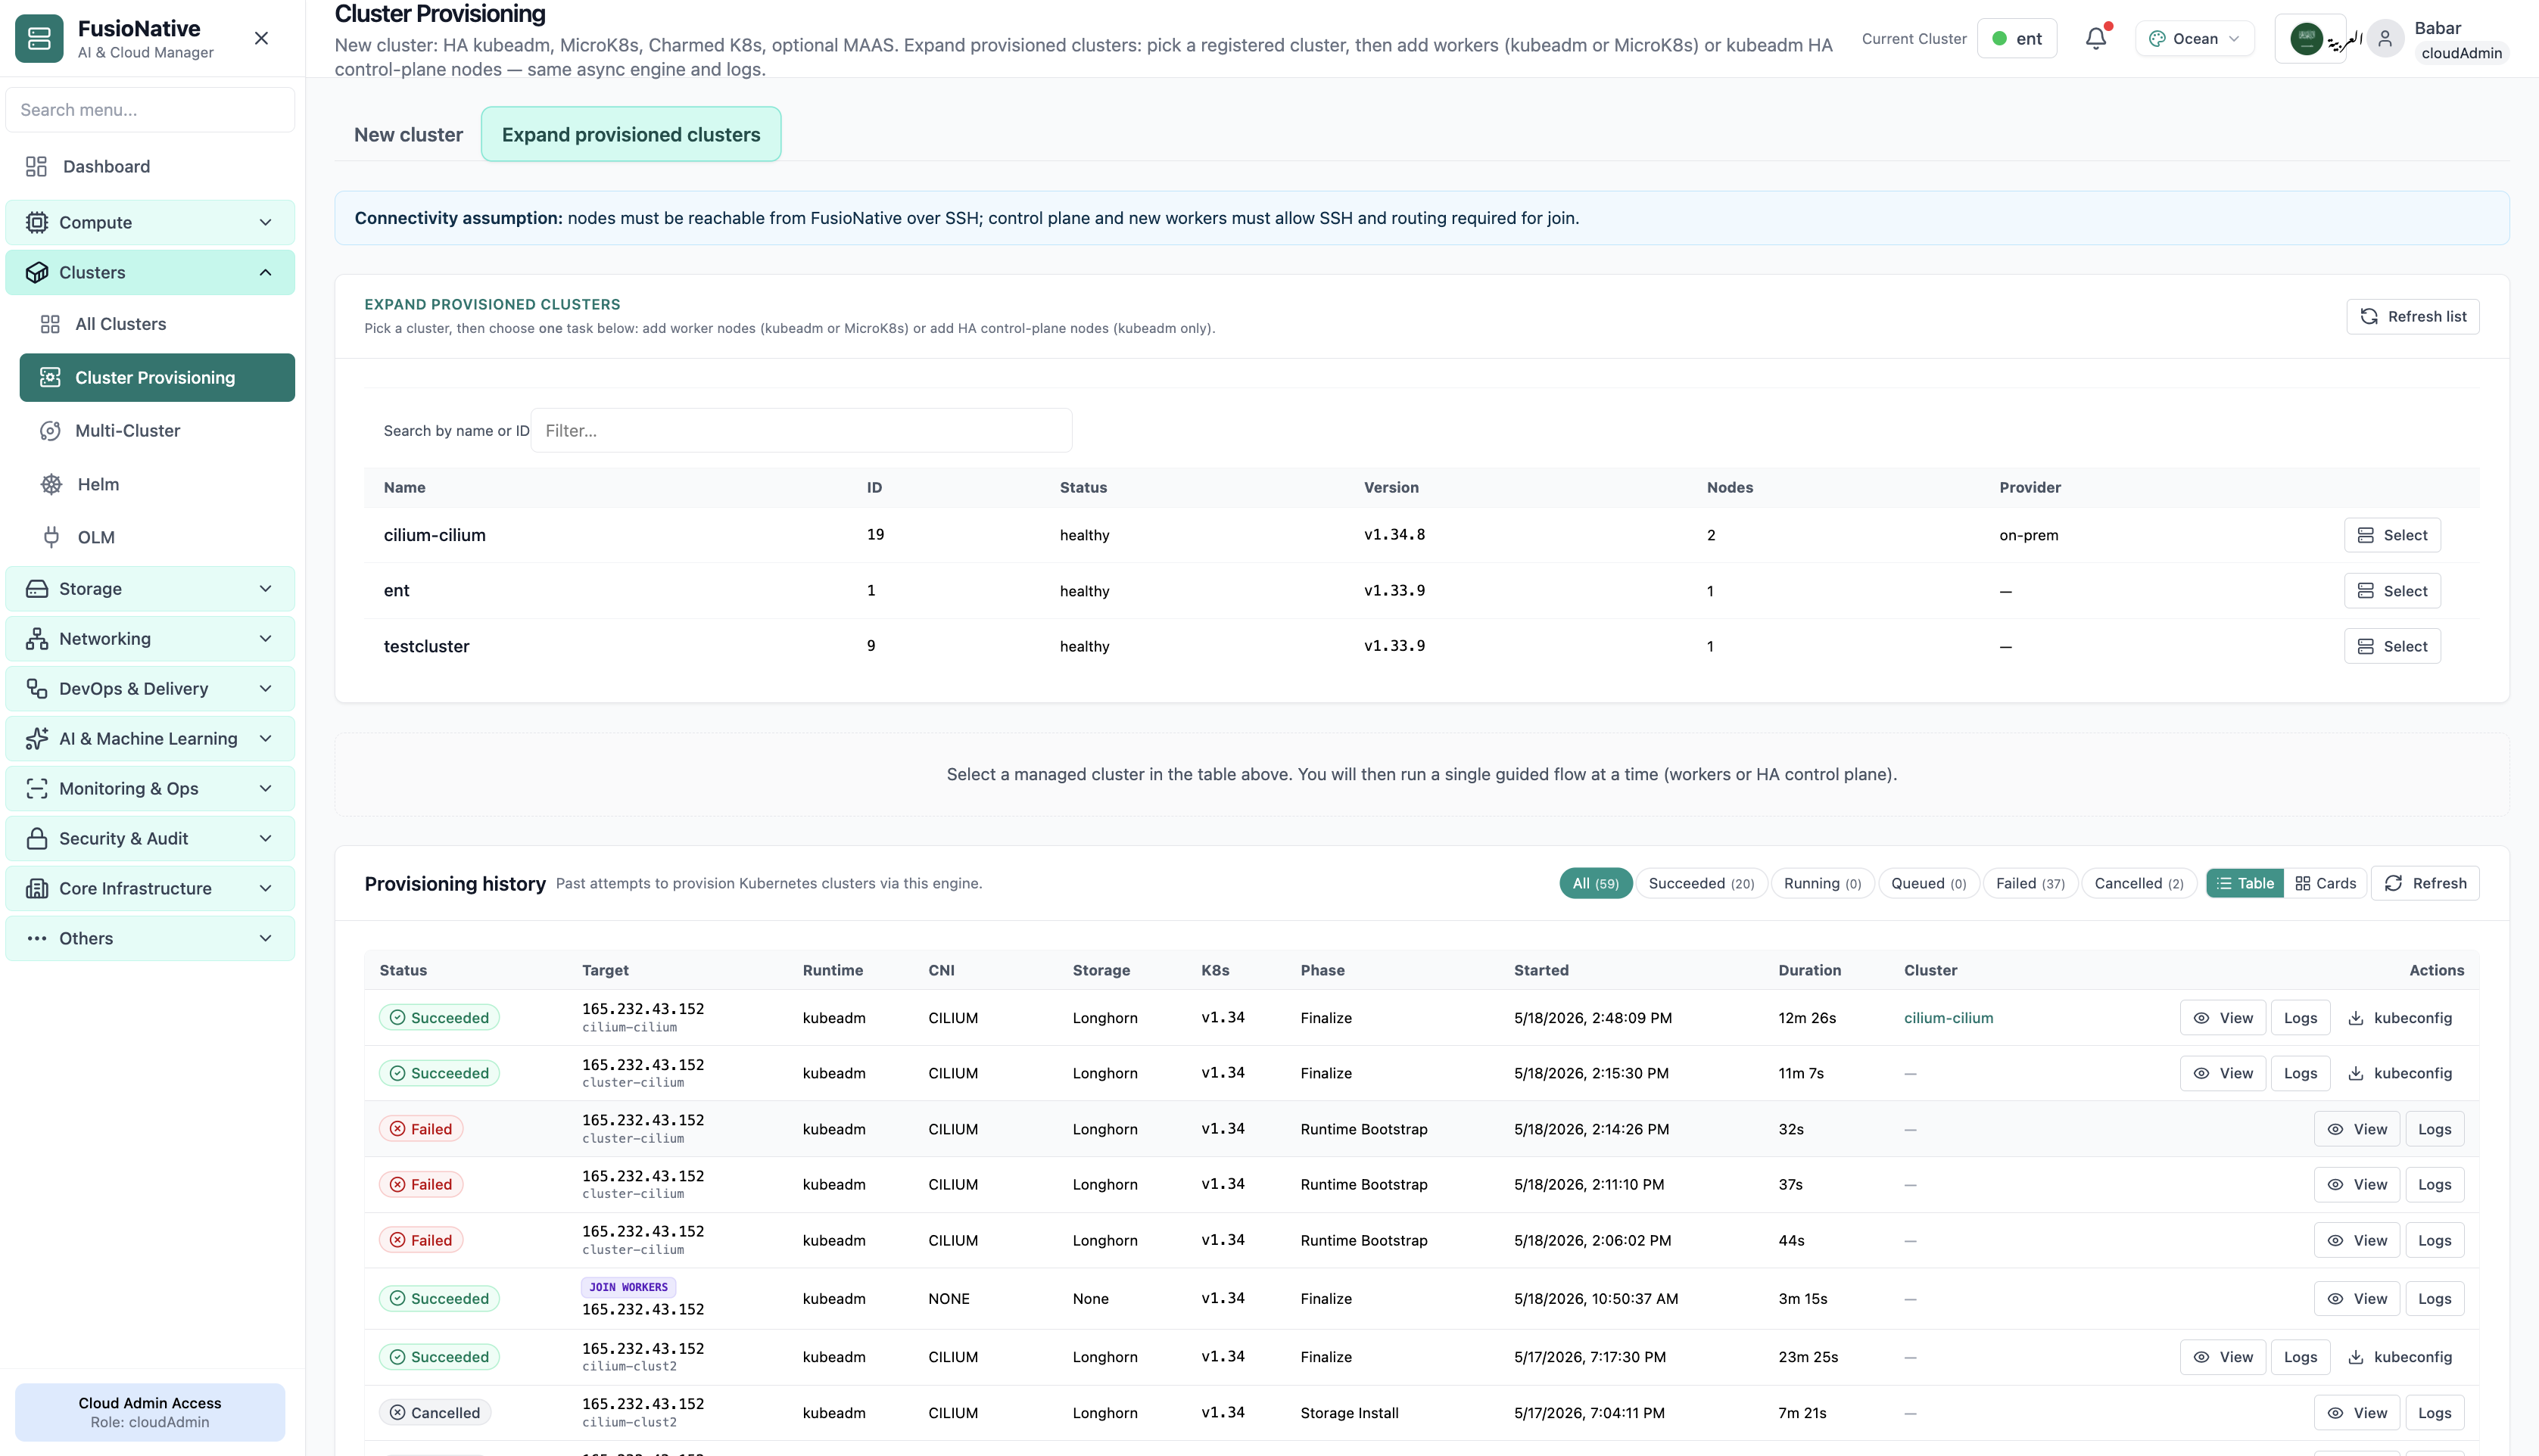
Spin environments with guided provisioning—less time before first customer deploy.
Click the screenshot to open full size, zoom, and pan.
Industry · Internal developer platforms
Tenants and self-service for engineering customers
IDP teams sell golden paths. FusioNative backs the portal story with real tenancy—projects, quotas, billing visibility, and audit—while platform keeps fleet and policy control.
Give product teams workspaces and meters; keep clusters and policy in platform hands.
Product screens with notes on when each view matters for your sector.
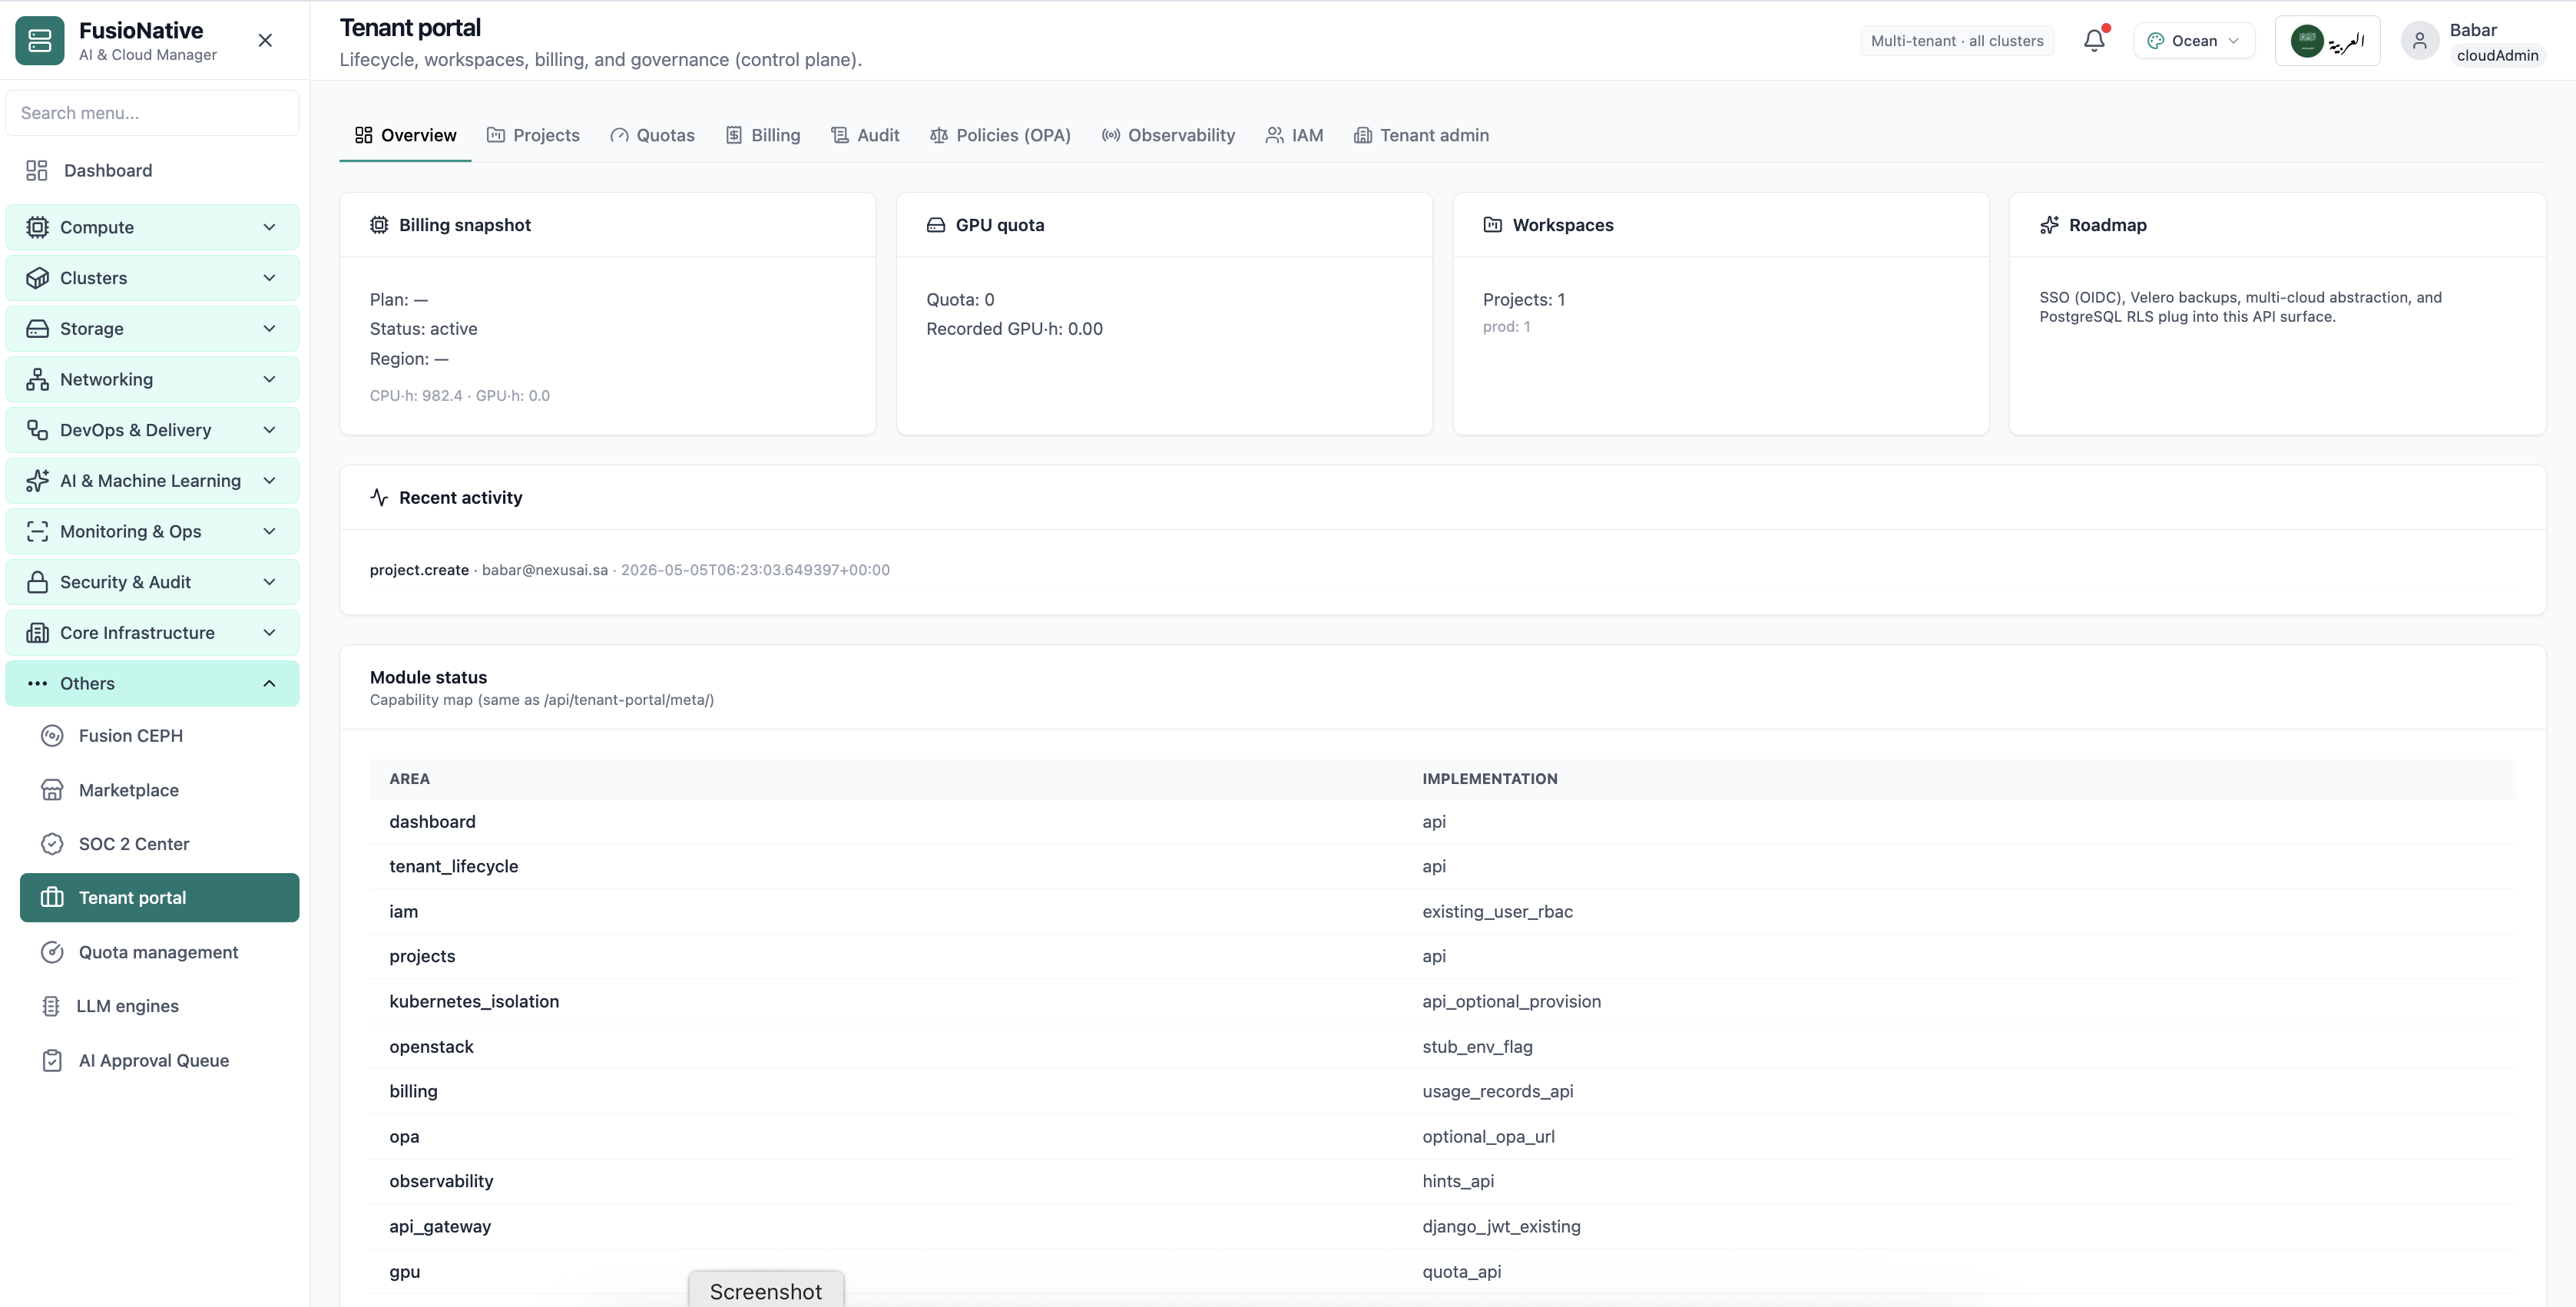
Per-tenant KPIs developers recognize—usage, quota, and workspace entry.
Click the screenshot to open full size, zoom, and pan.
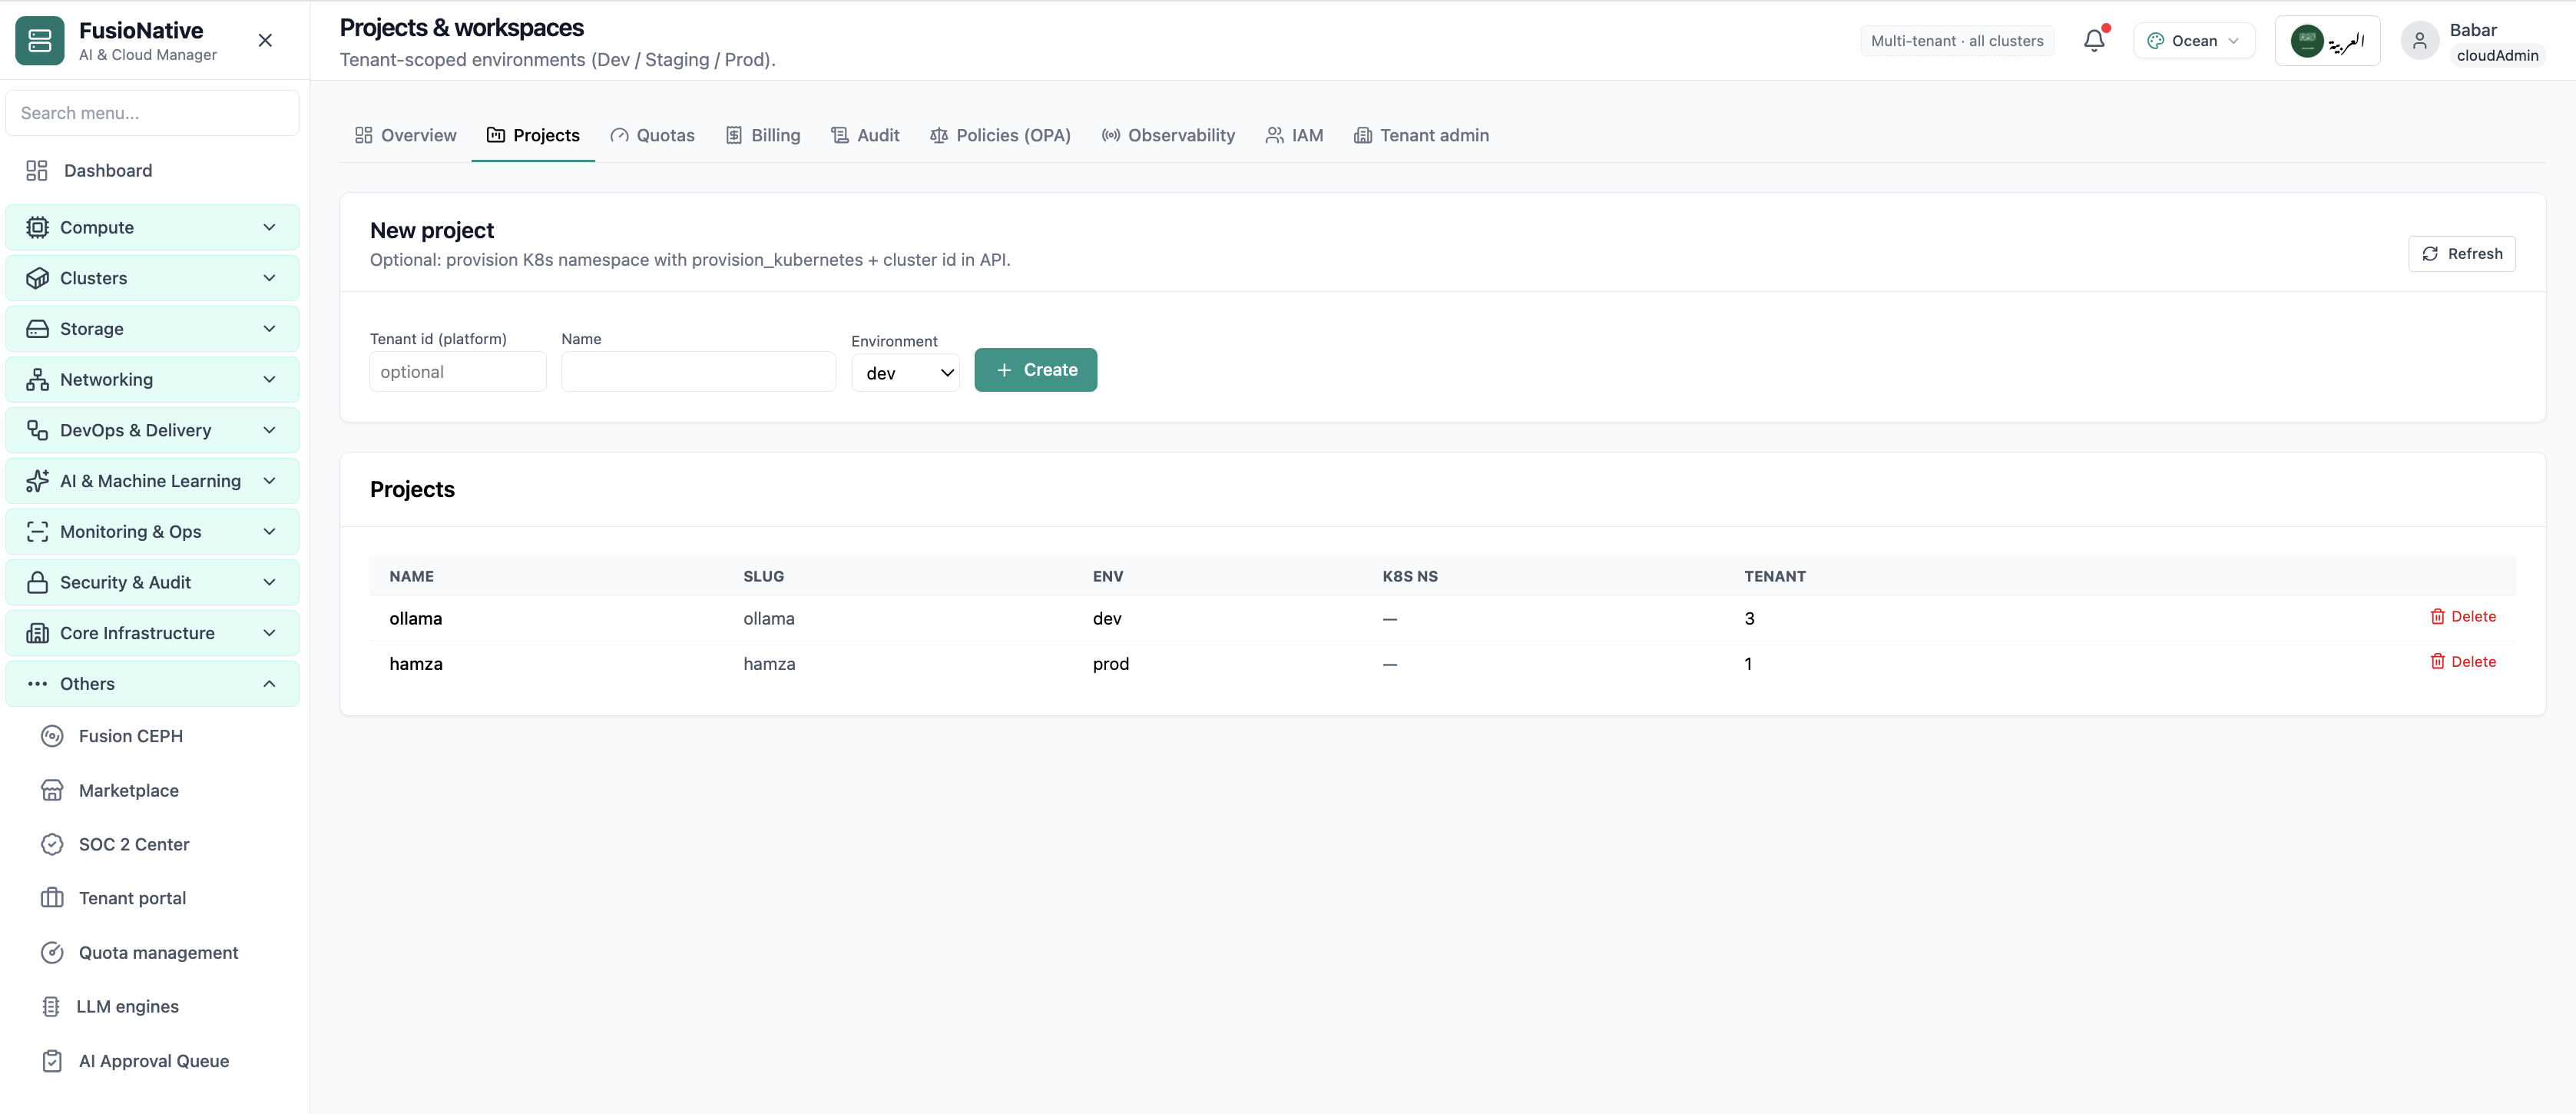
How teams organize services inside a tenant—matches IDP mental models.
Click the screenshot to open full size, zoom, and pan.
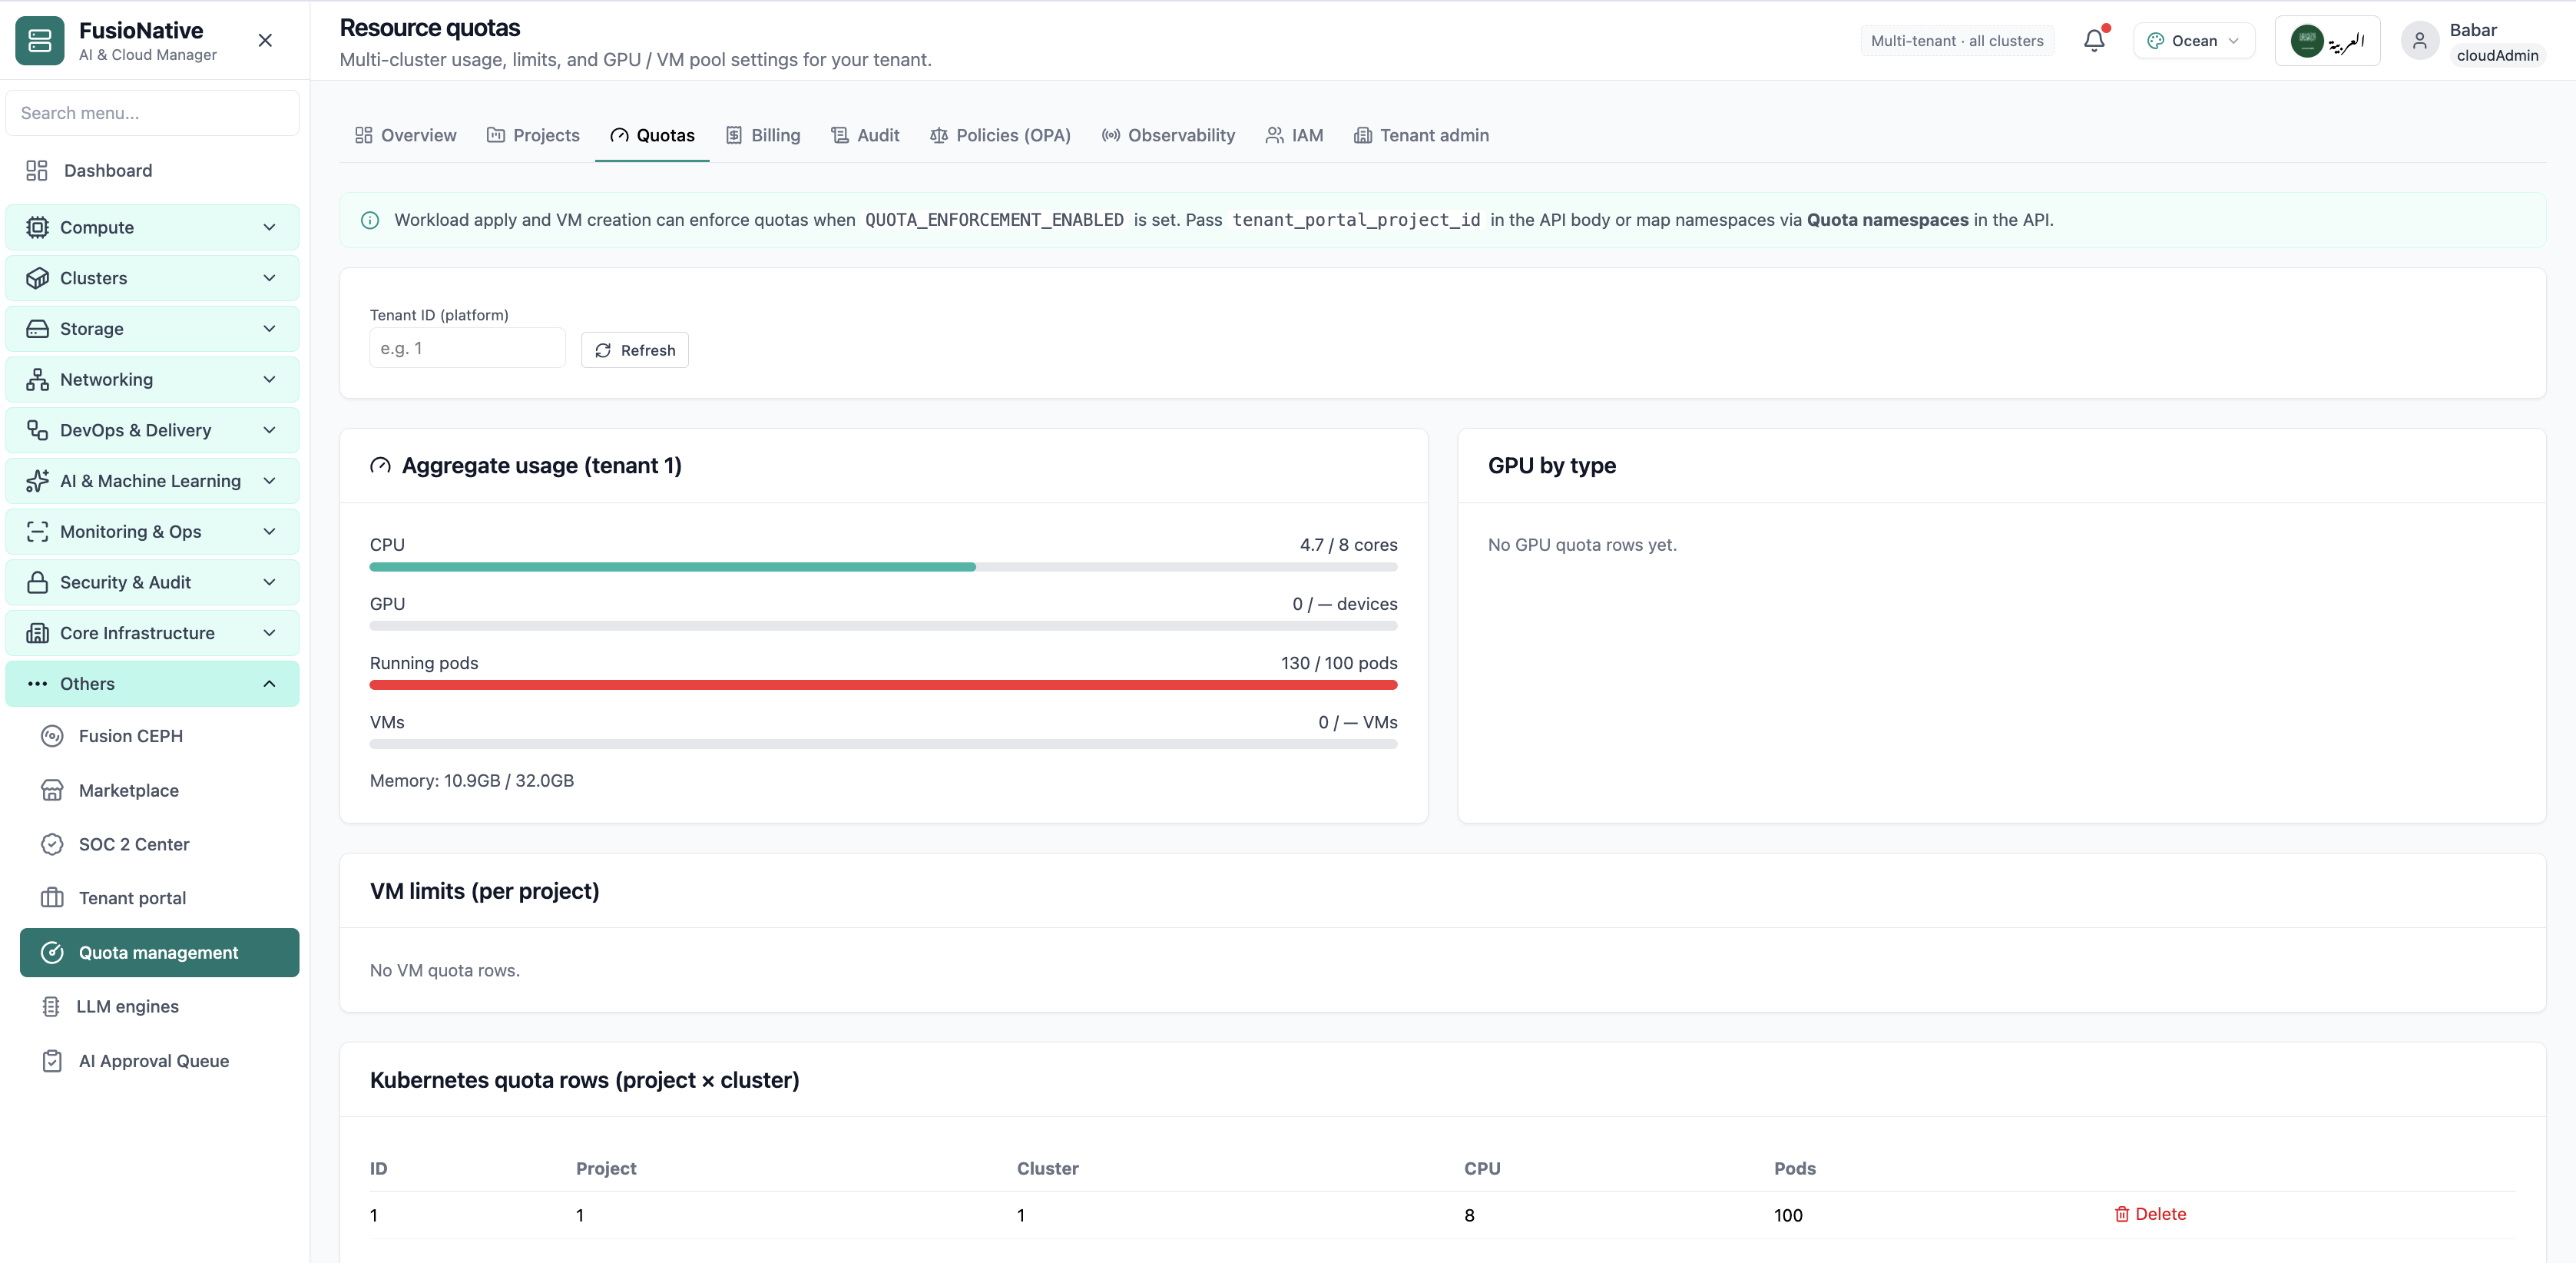
Hard limits platform can enforce—objective end to quota arguments.
Click the screenshot to open full size, zoom, and pan.