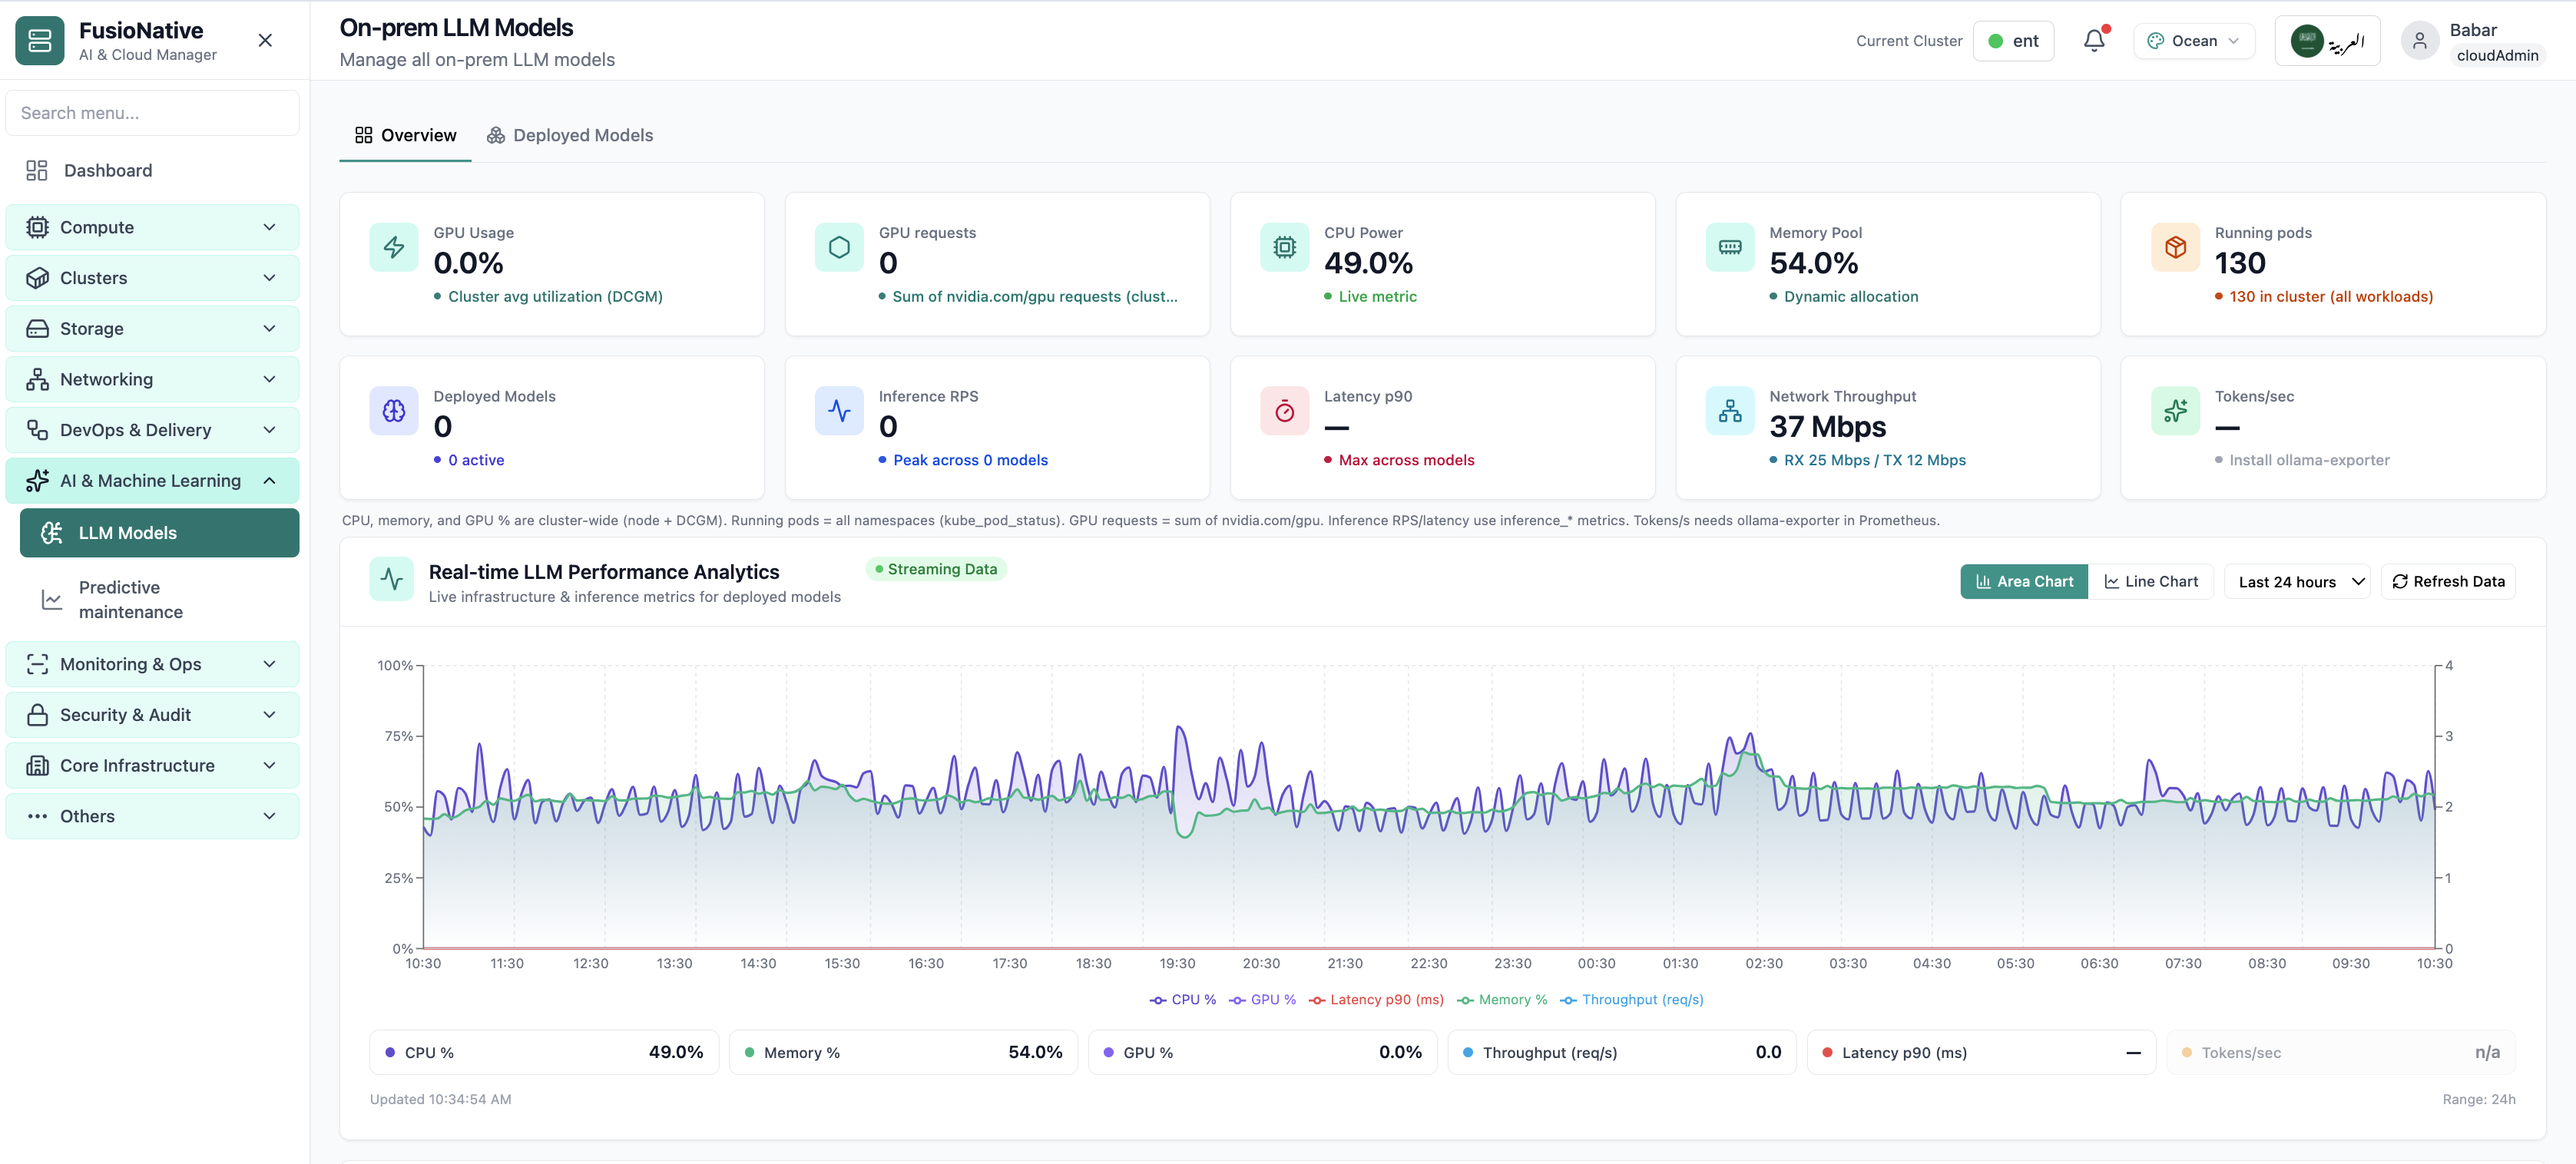
AI & GPU metrics
GPU and LLM performance metrics from the on-prem AI workspace.
- GPU and cluster metrics on one screen
- Click to zoom in
- Works alongside the rest of Cloud Admin
Click the screenshot to open full size, zoom, and pan.
AI & ML
Run AI workloads, deploy on-prem LLM models, and leverage predictive maintenance signals — all on your own infrastructure.
Sovereign AI
AI inference and training are capacity programs, not side projects. FusioNative ties GPU utilization, LLM deployment signals, and pod-level GPU usage into the same console as the rest of your estate.
Screens from the live product, with a short note on when you would open each view.
GPU and LLM performance metrics from the on-prem AI workspace.
Click the screenshot to open full size, zoom, and pan.
Give ML platforms the telemetry they expect while keeping security and infrastructure teams in one operational loop.
AI & Machine Learning · Inference
Manage every on-prem model from one cockpit: flip between Overview and Deployed Models, watch GPU signals from DCGM, correlate CPU and memory with cluster pods, and track inference throughput, latency, tokens, and network paths serving traffic. When you are ready to ship, choose Deploy Existing (reuse an attached cluster) or Deploy New (stand up fresh resources), without losing Prometheus or optional Ollama exporter telemetry.
Screens from the live product, with a short note on when you would open each view.
Your starting point for on-prem LLM models: KPI cards and charts summarize fleet health, including on-prem llm models overview with gpu and inference metrics. Spot drift early, then drill into the tab that explains the root cause.
Click the screenshot to open full size, zoom, and pan.
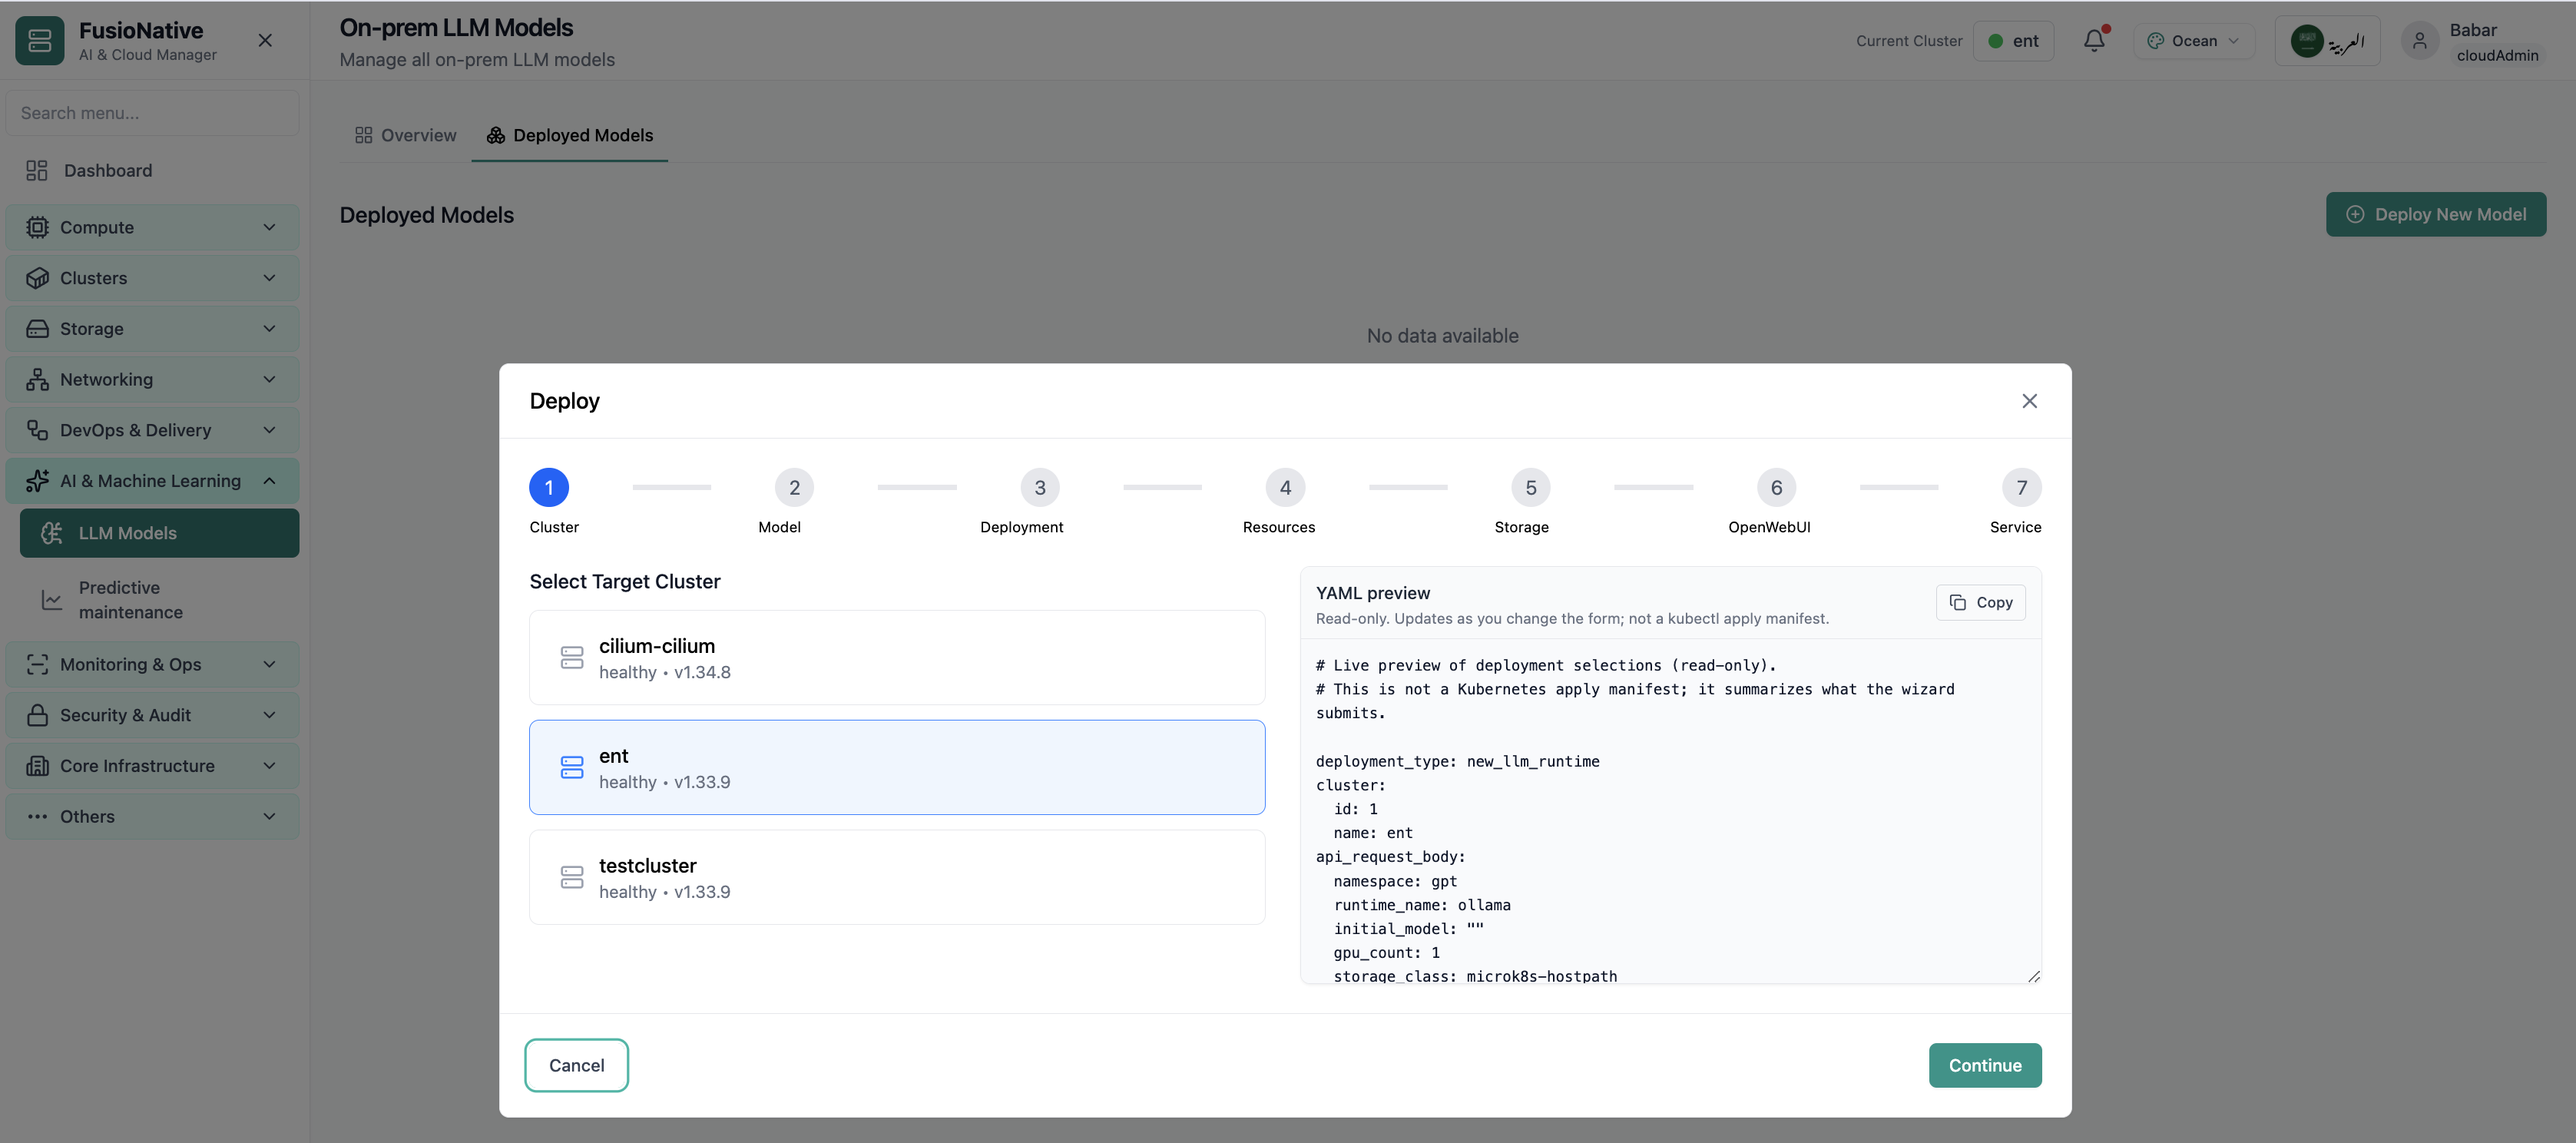
The deploy wizard’s Cluster step is where operators confirm llm deploy wizard cluster step Each screen validates inputs before you advance, so GPU, storage, and networking stay aligned with cluster quotas and your on-prem policy.
Click the screenshot to open full size, zoom, and pan.
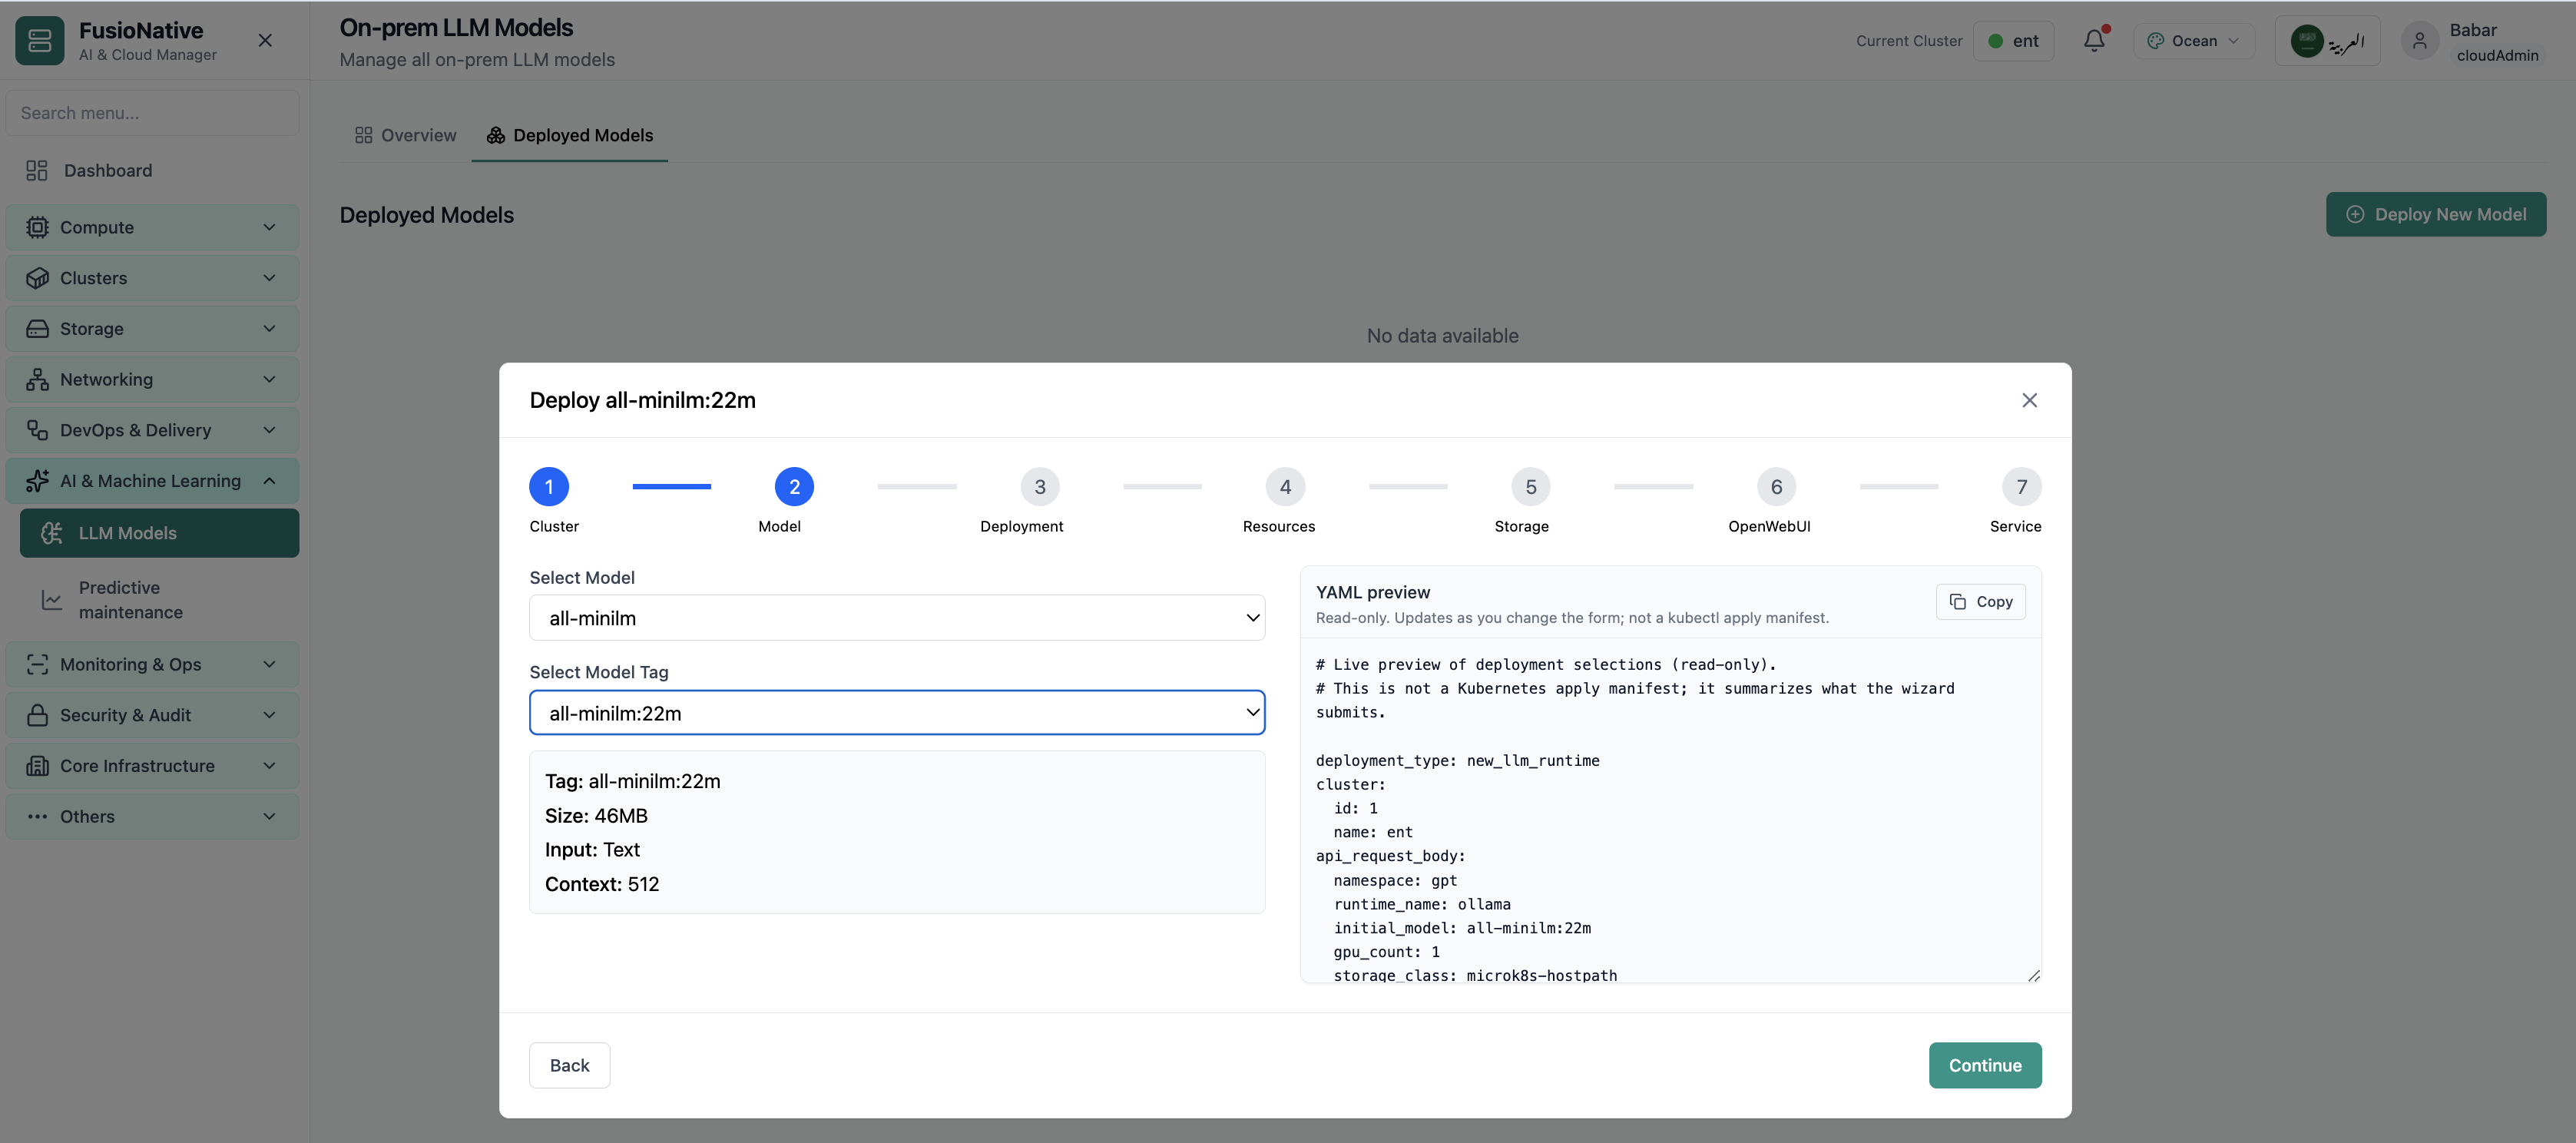
The deploy wizard’s Model step is where operators confirm llm deploy wizard model selection Each screen validates inputs before you advance, so GPU, storage, and networking stay aligned with cluster quotas and your on-prem policy.
Click the screenshot to open full size, zoom, and pan.
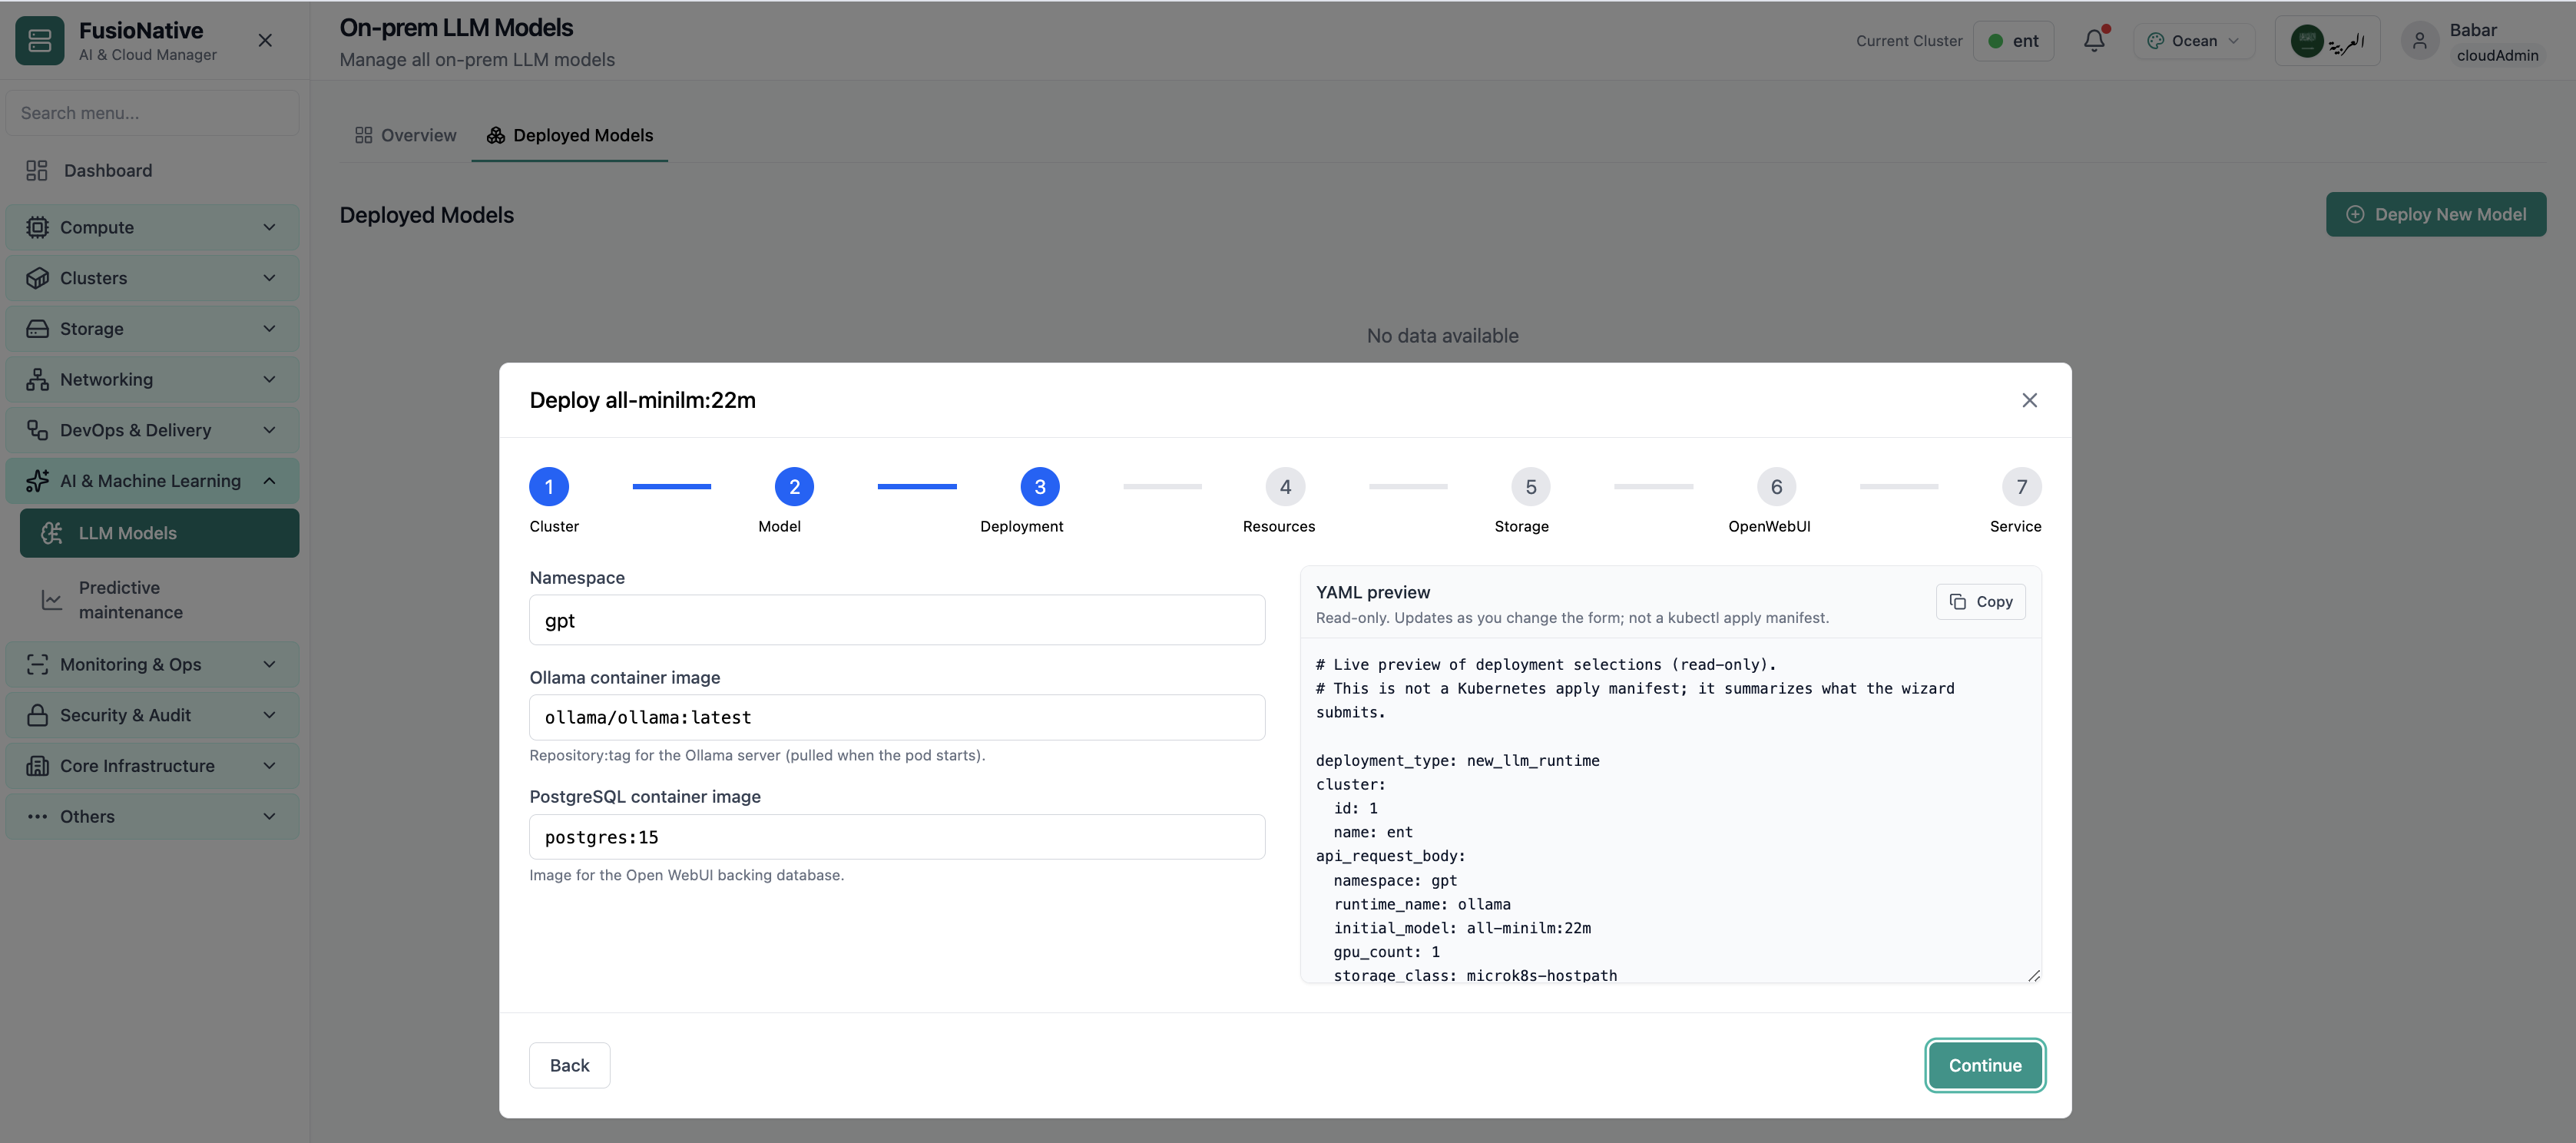
The deploy wizard’s Deployment step is where operators confirm llm deployment configuration step Each screen validates inputs before you advance, so GPU, storage, and networking stay aligned with cluster quotas and your on-prem policy.
Click the screenshot to open full size, zoom, and pan.
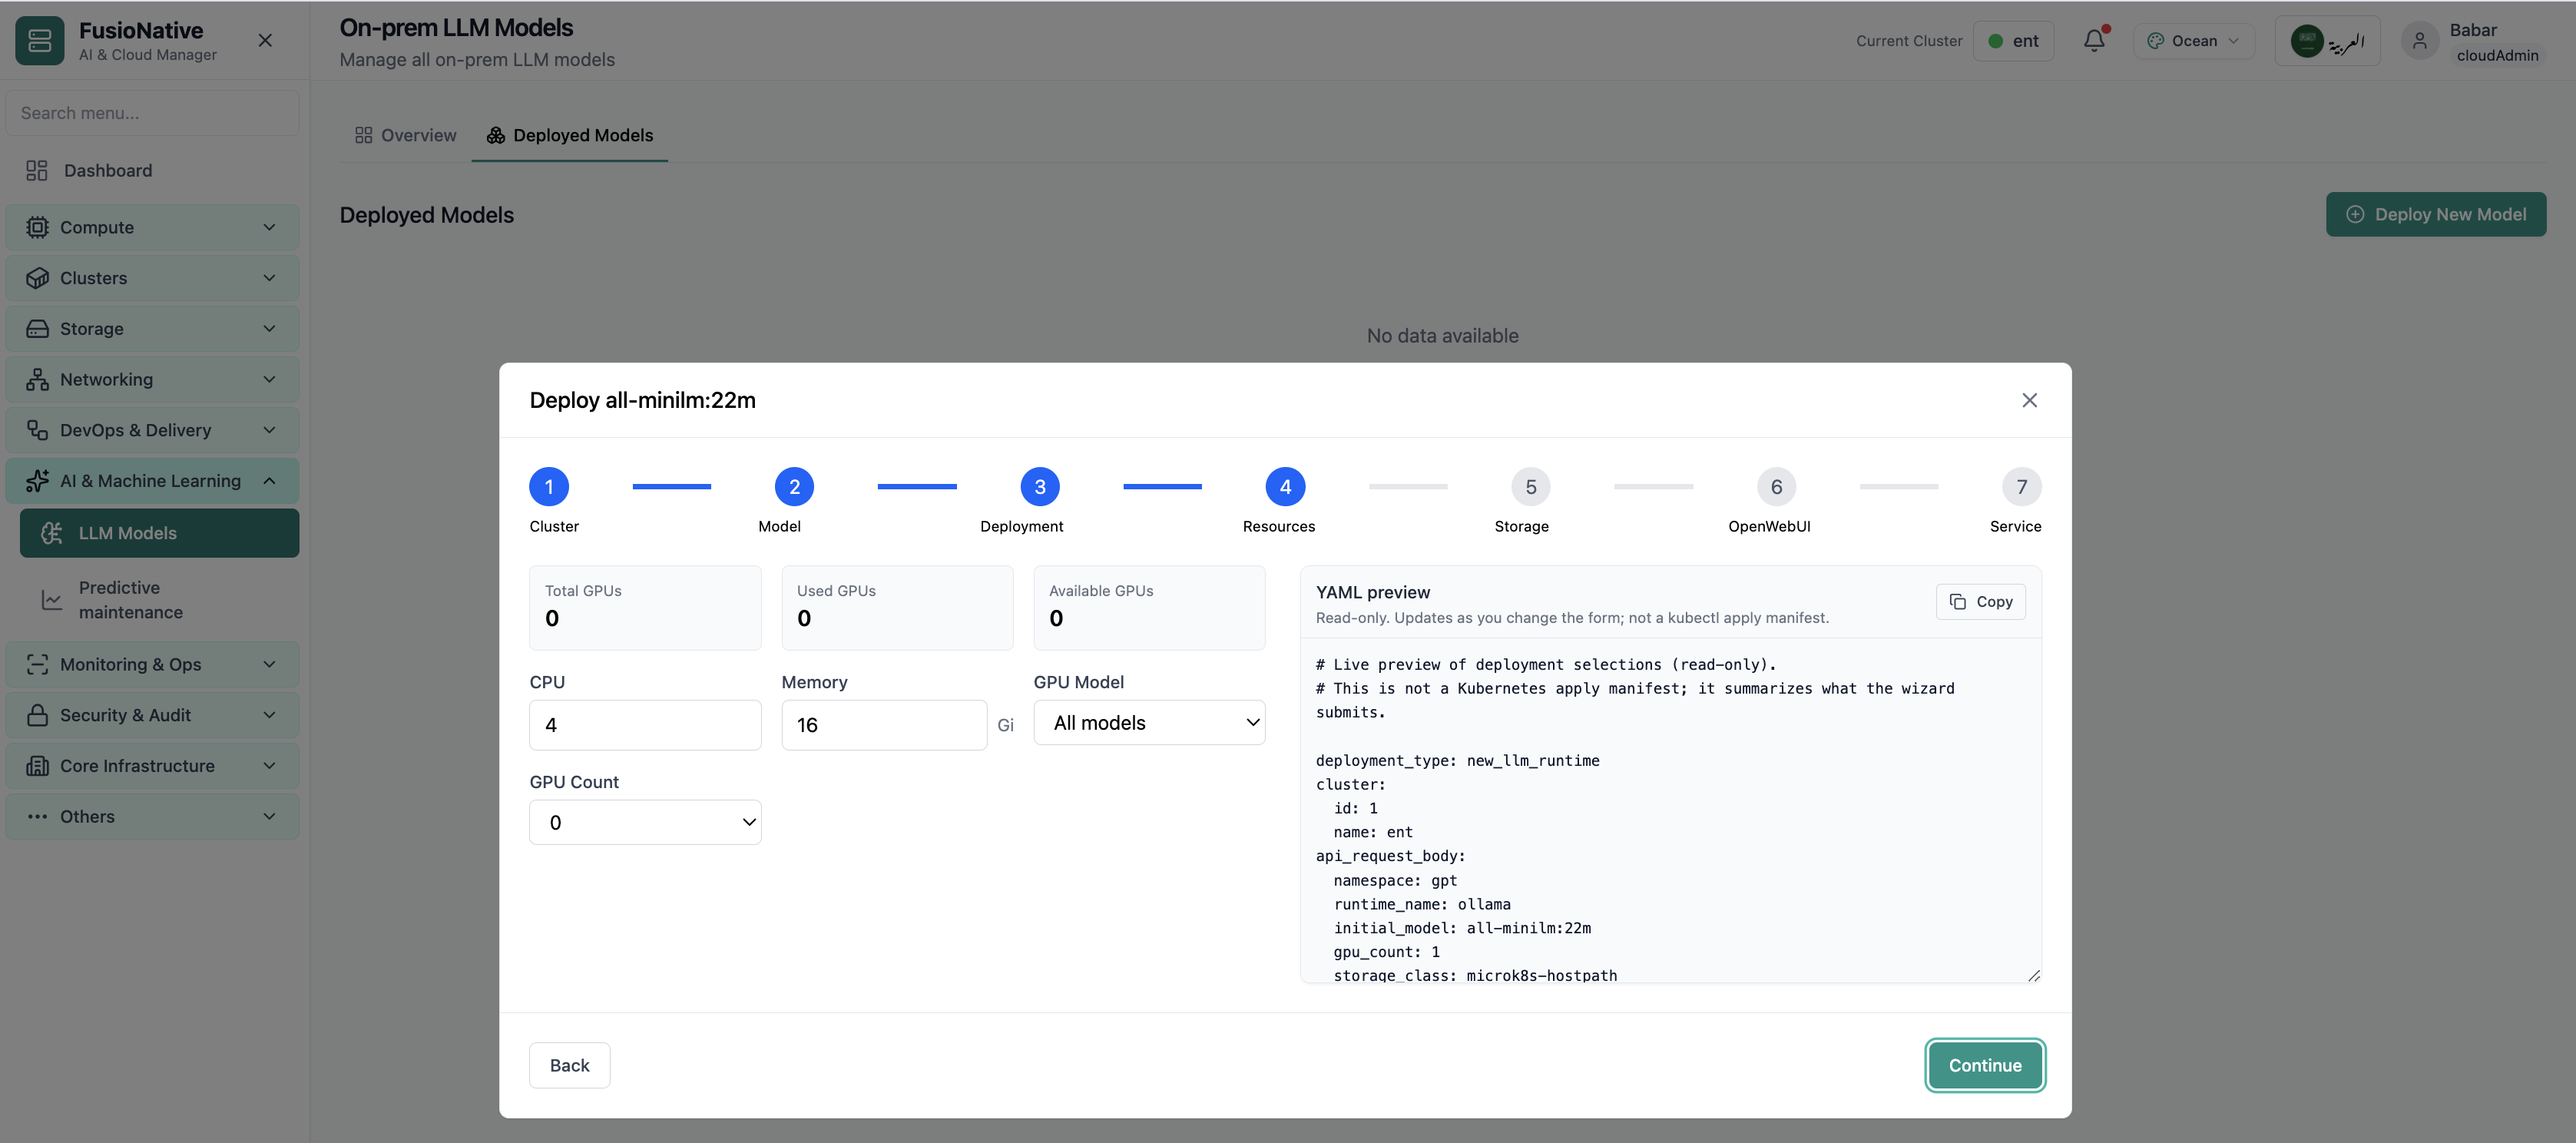
The deploy wizard’s Resources step is where operators confirm llm resource and gpu allocation Each screen validates inputs before you advance, so GPU, storage, and networking stay aligned with cluster quotas and your on-prem policy.
Click the screenshot to open full size, zoom, and pan.
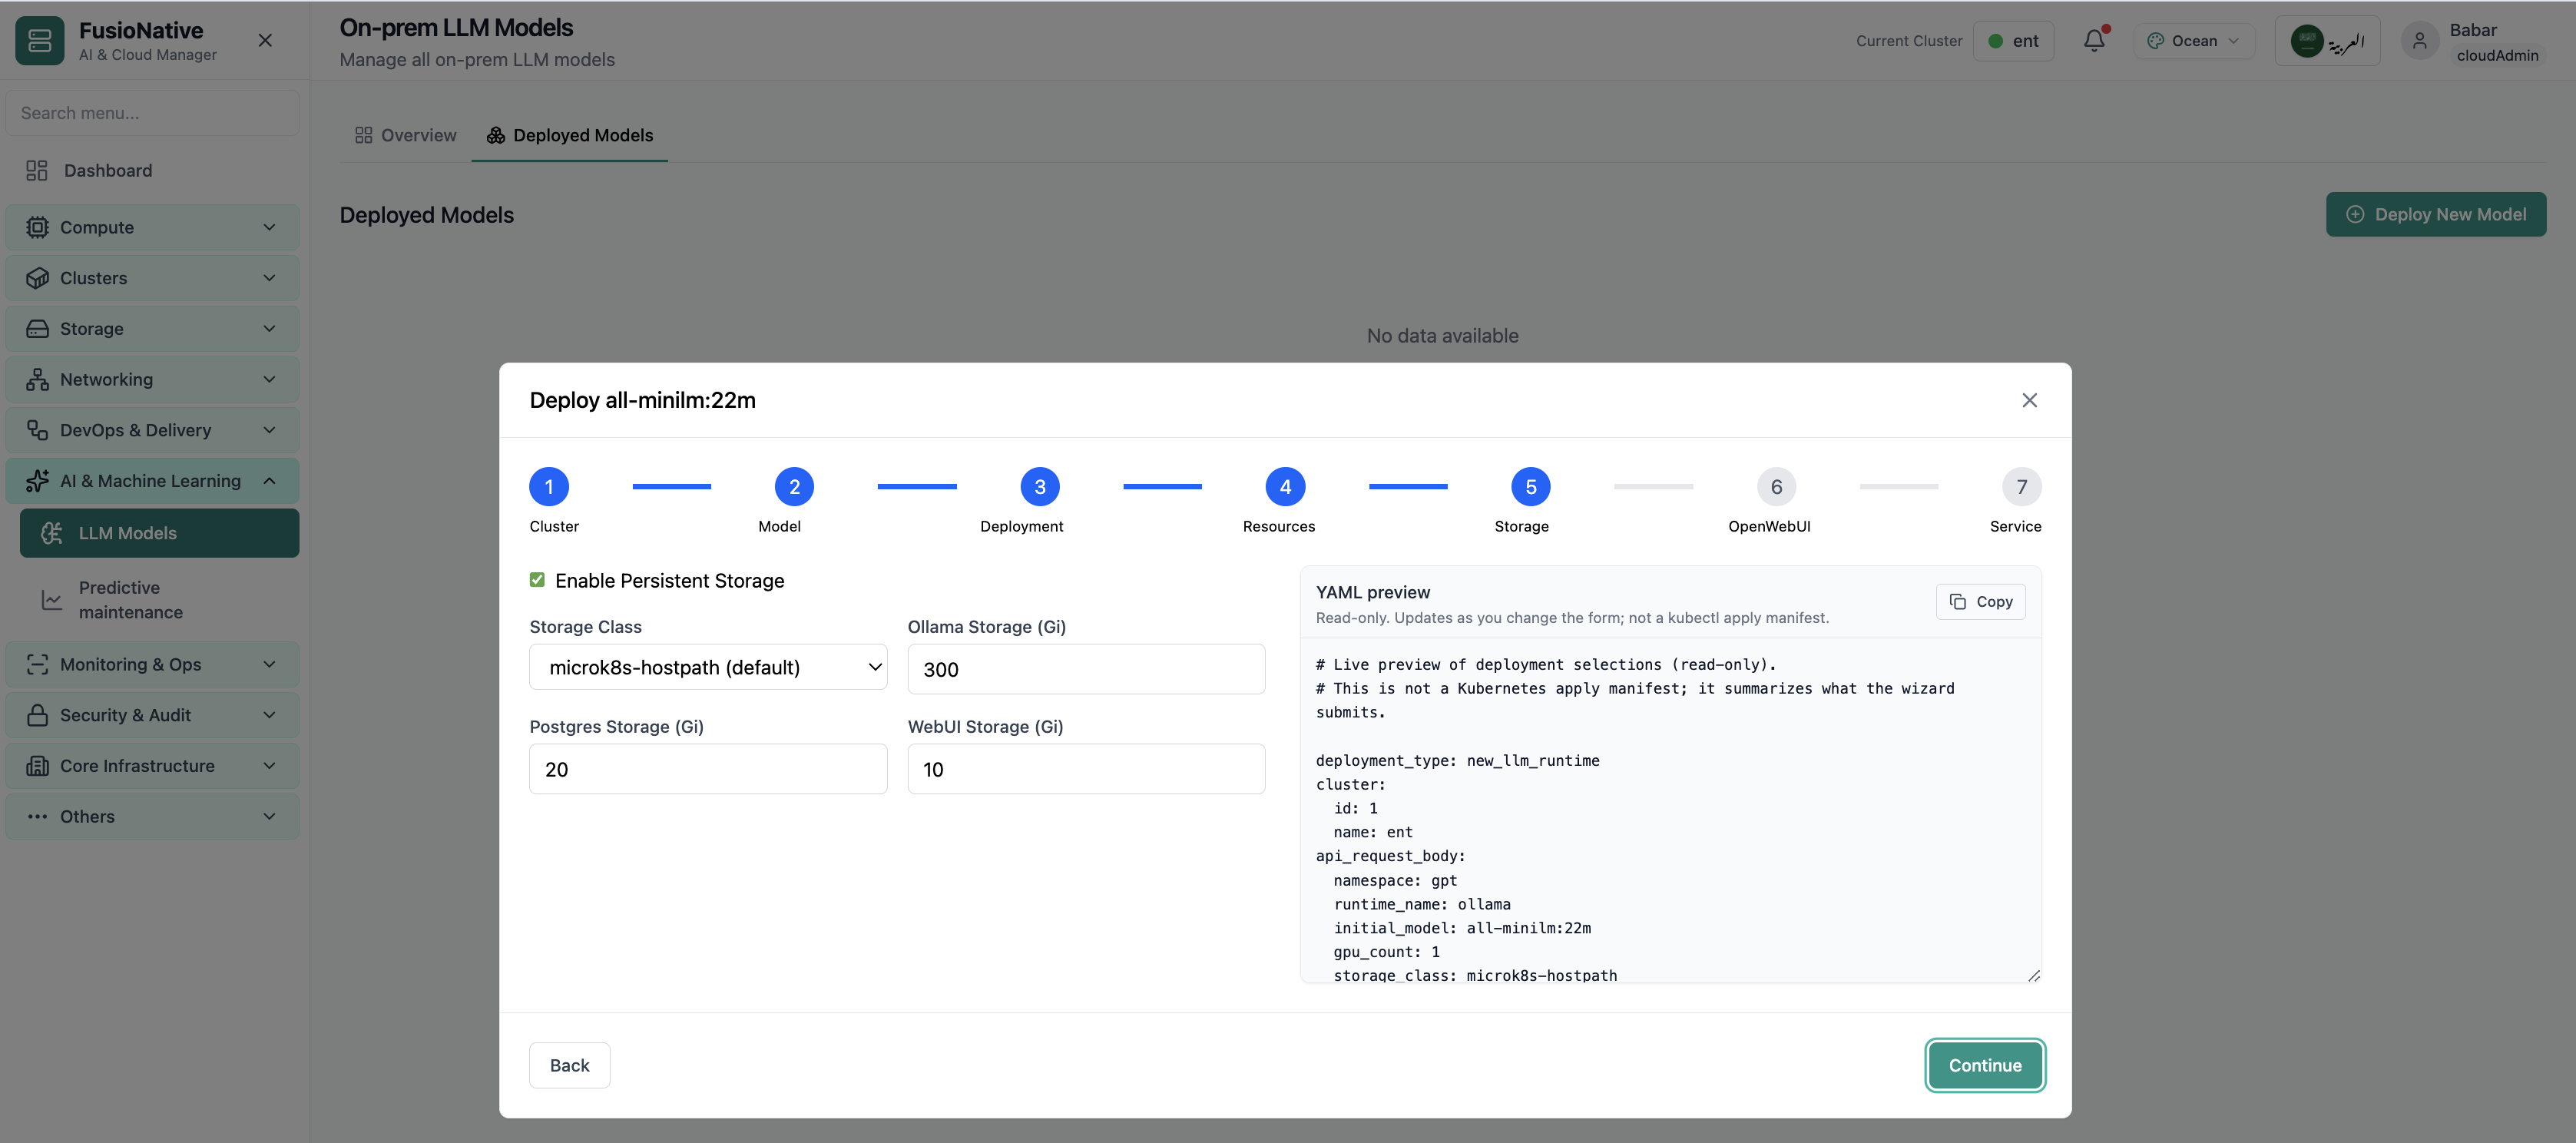
The deploy wizard’s Storage step is where operators confirm persistent storage for llm runtime Each screen validates inputs before you advance, so GPU, storage, and networking stay aligned with cluster quotas and your on-prem policy.
Click the screenshot to open full size, zoom, and pan.
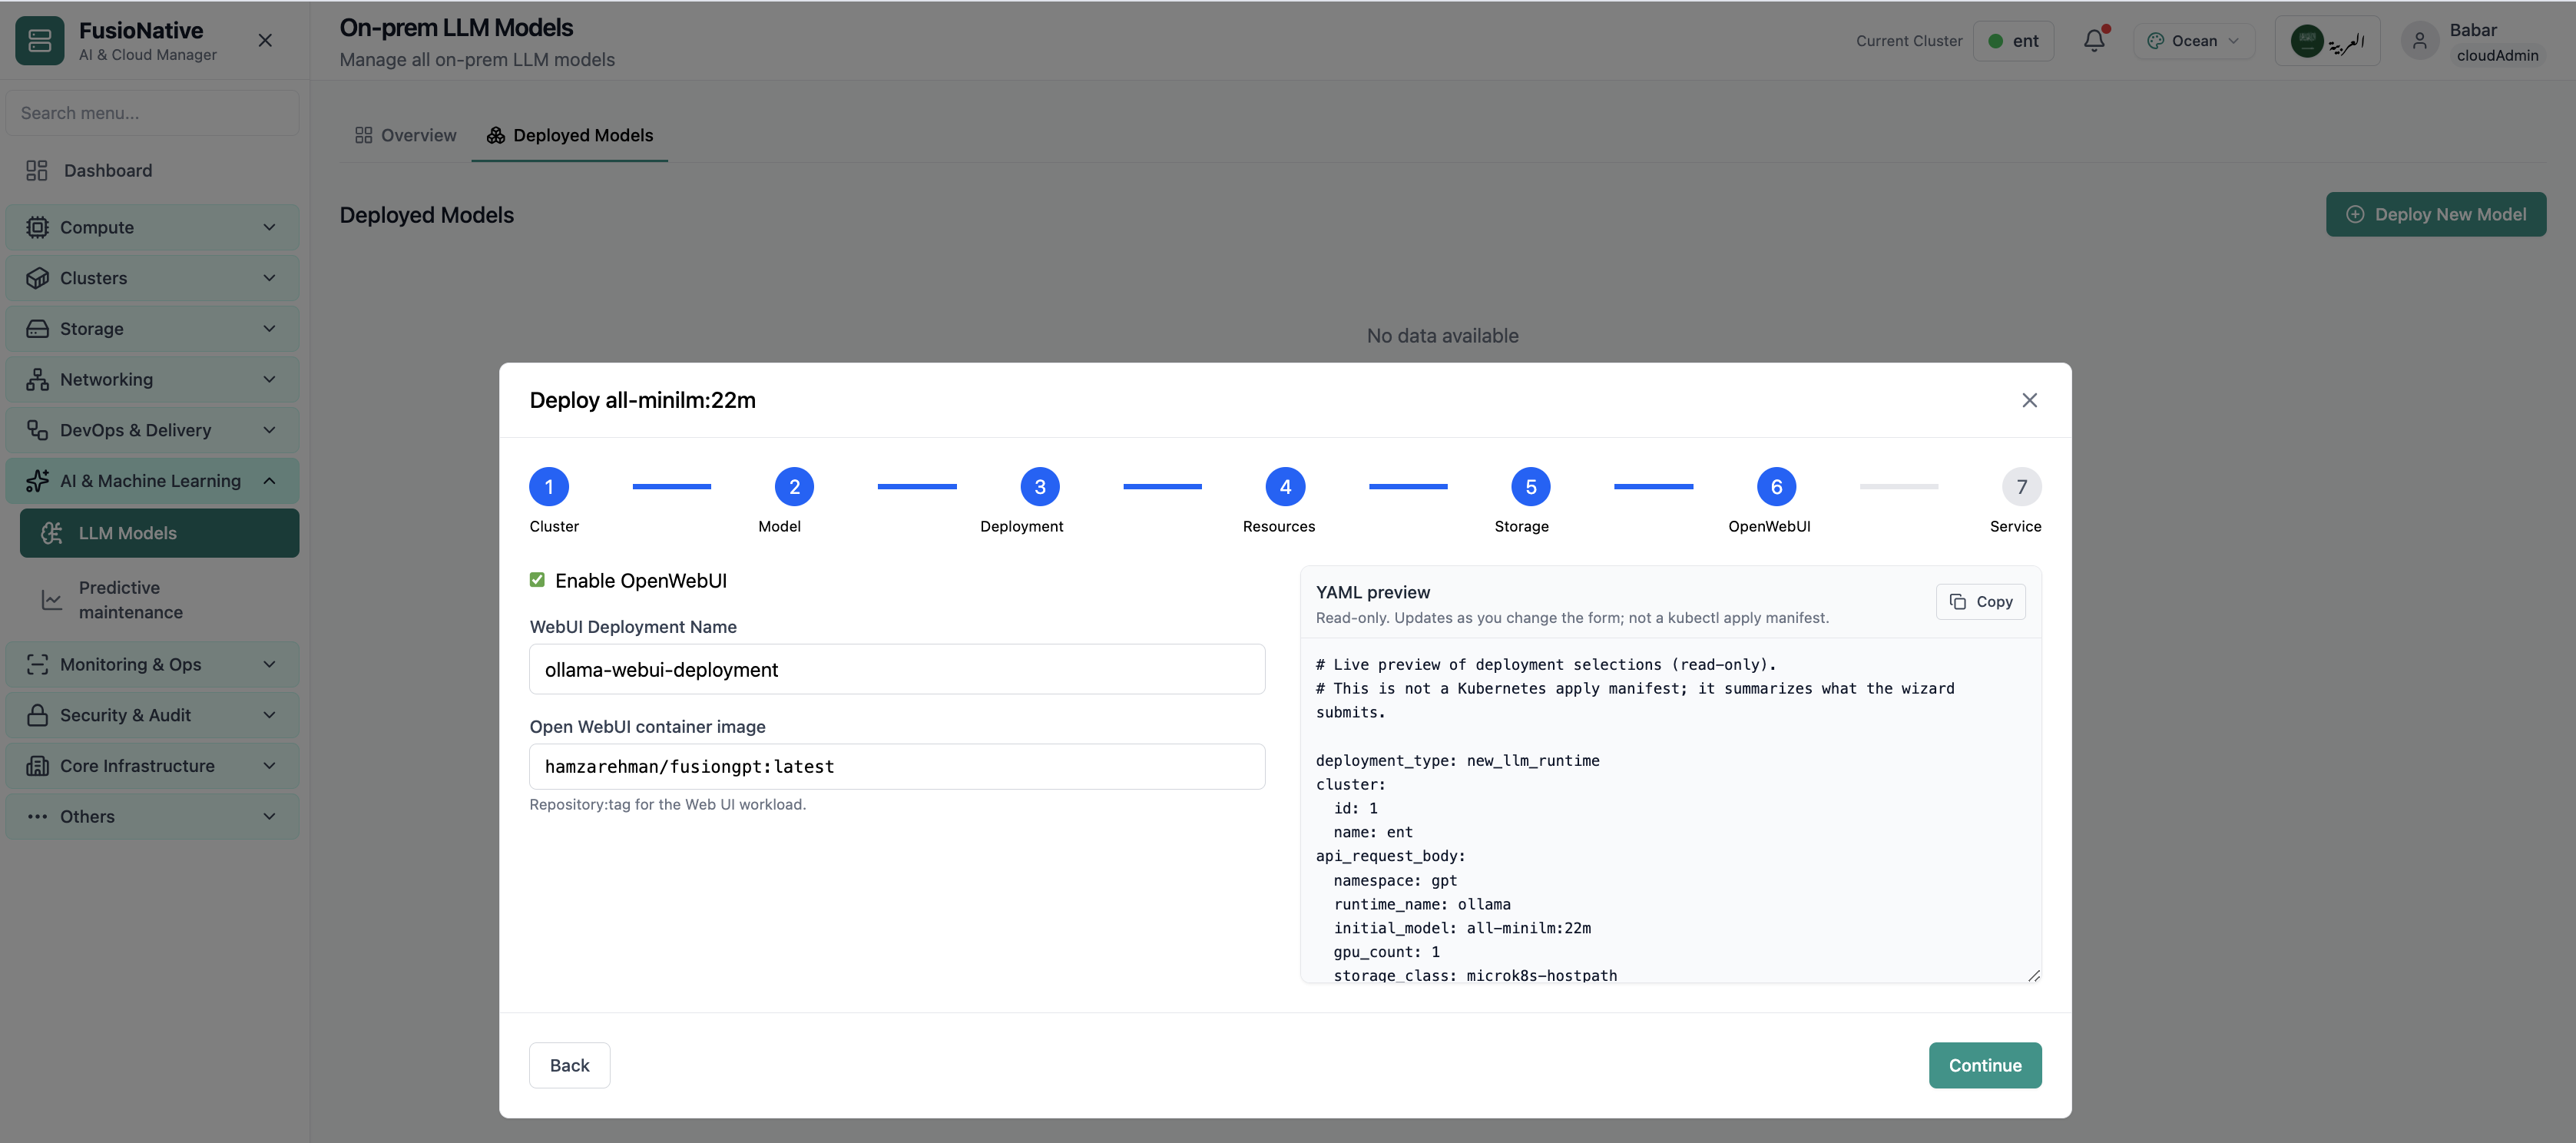
The deploy wizard’s OpenWebUI step is where operators confirm openwebui configuration step Each screen validates inputs before you advance, so GPU, storage, and networking stay aligned with cluster quotas and your on-prem policy.
Click the screenshot to open full size, zoom, and pan.
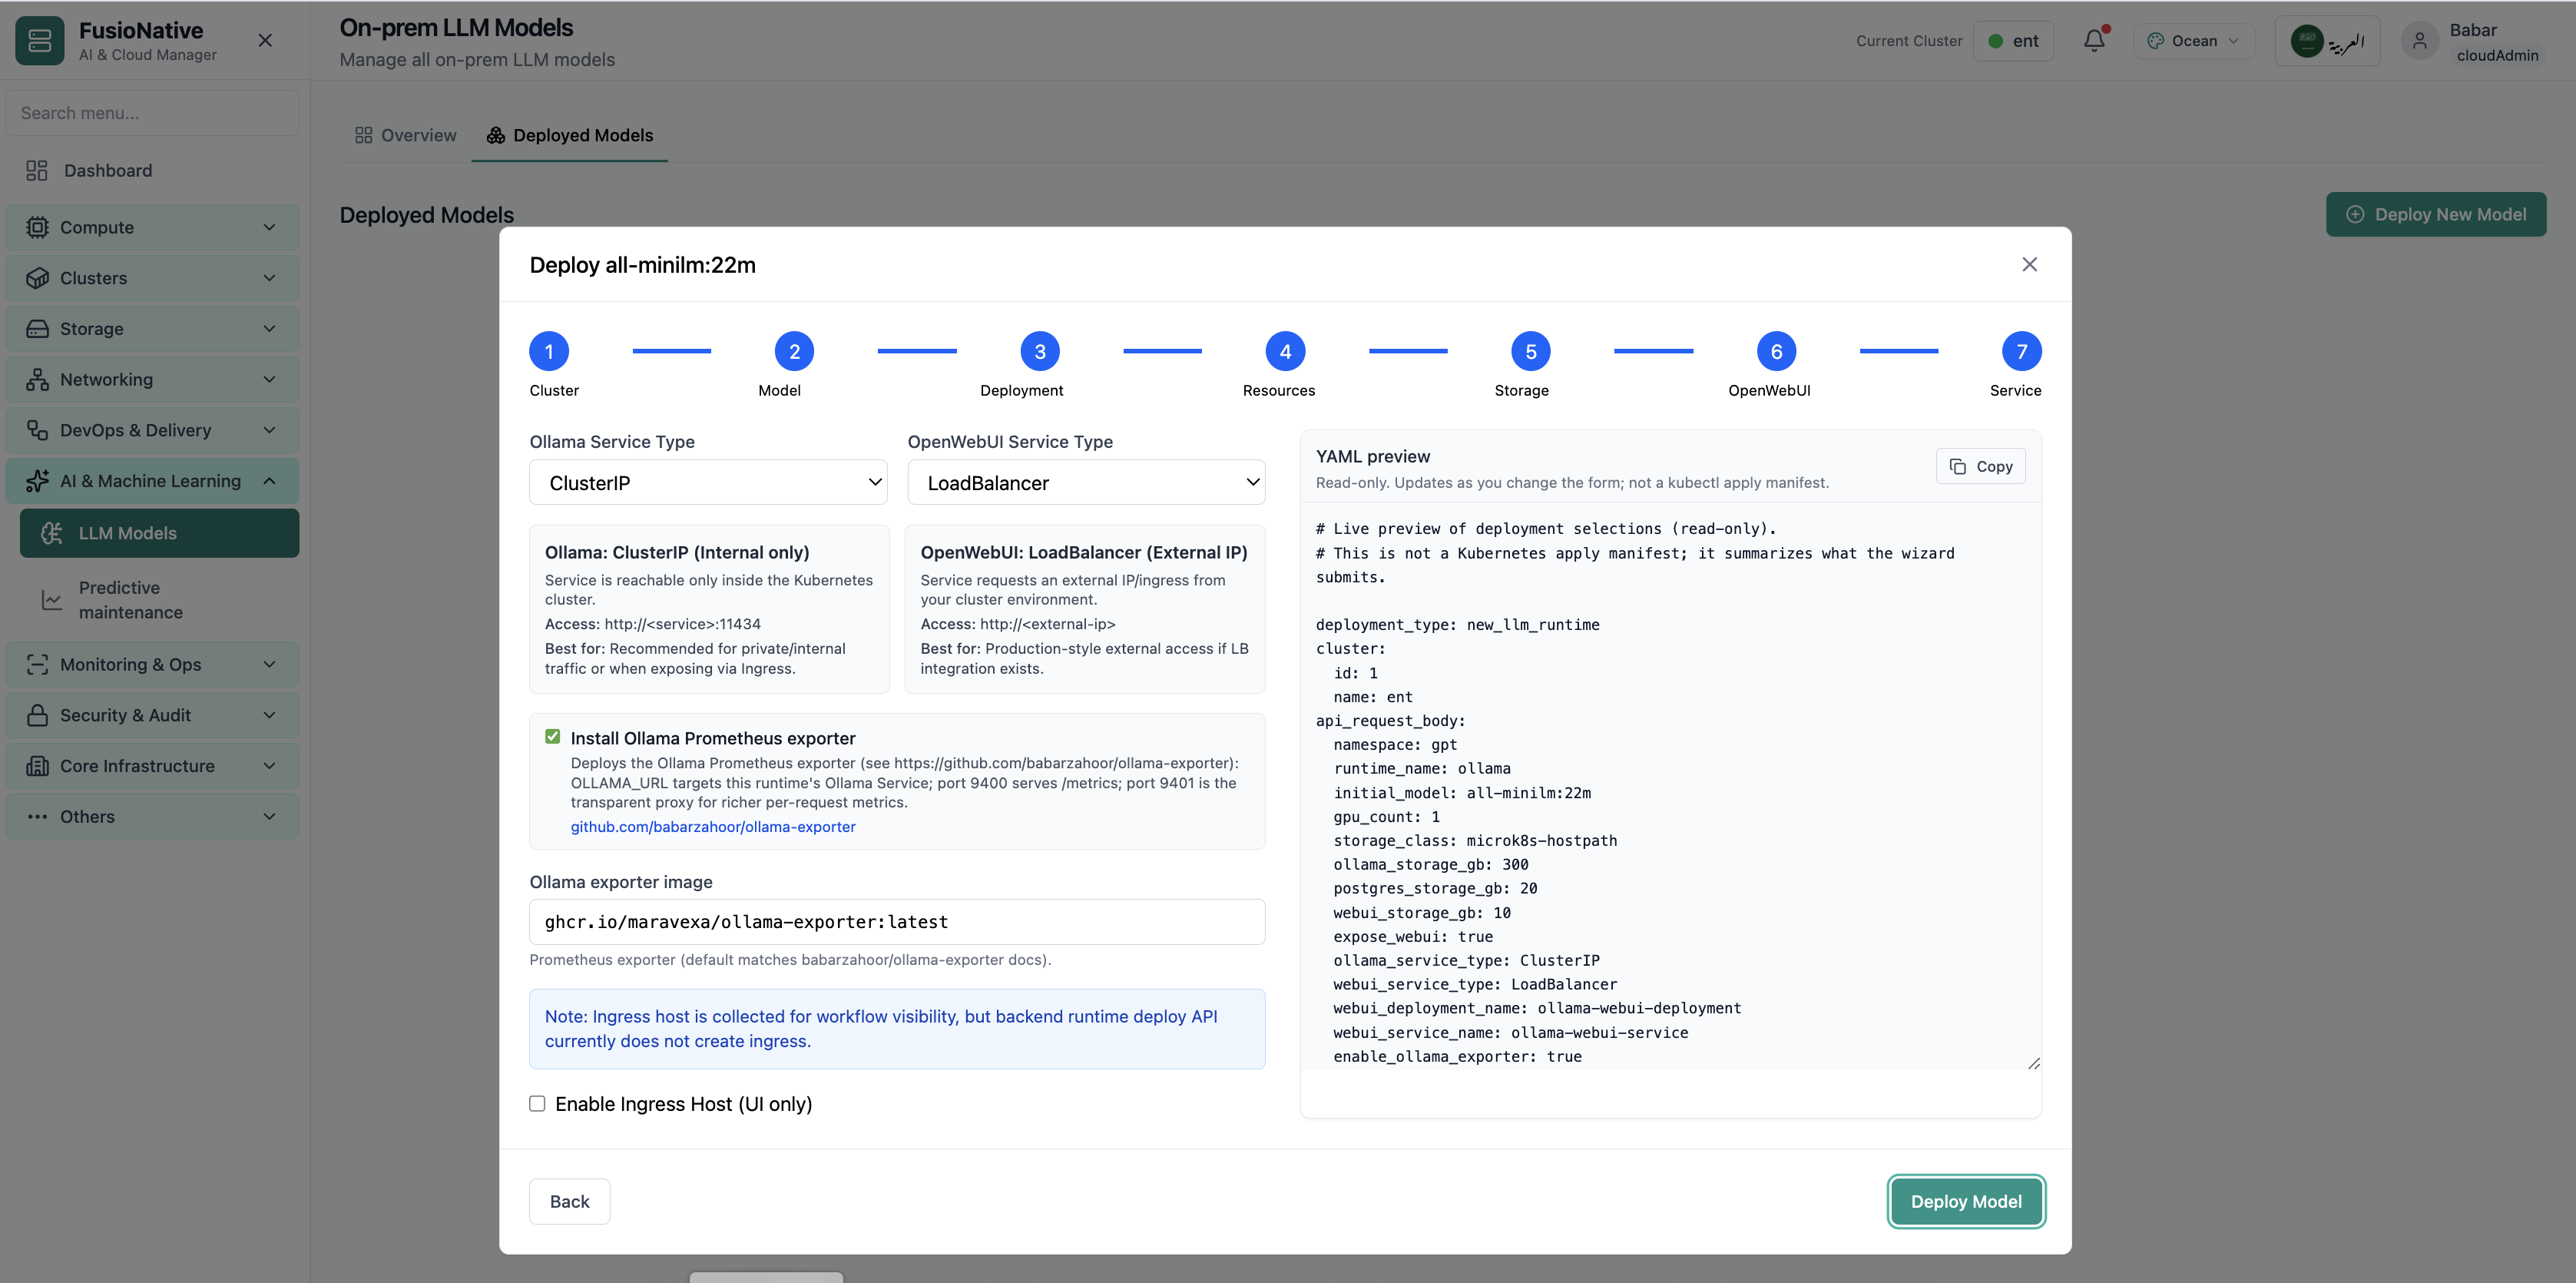
The deploy wizard’s Service step is where operators confirm llm service exposure step Each screen validates inputs before you advance, so GPU, storage, and networking stay aligned with cluster quotas and your on-prem policy.
Click the screenshot to open full size, zoom, and pan.
When GPUs, tokens, and latency share one Overview, AI platform teams rehearse capacity instead of guessing during spikes.
Missing exporters surface as explicit signals, no synthetic token rates.
Existing vs net-new paths keep brownfield and greenfield teams on rails.
Pods, GPUs, and network tubes tie back to model serving, not disconnected dashboards.
Operate LLM Models from Cloud Admin alongside Kubernetes, observability, and delivery workflows.
Get a demoAI & Machine Learning · Reliability
See where your cluster is headed before users do: Overview ties a risk score and incident probability to compact recommendations, trend charts, and forecast rows with horizons and confidence. Fleet Risk rolls assessments across clusters by provider, region, and environment. Audit streams policies, planned actions, reinforcement-learning feedback, and alerts in one filterable feed. Under the hood, signal pipelines ingest Kubernetes events, GPU and hardware posture, anomaly features, topology RCA, and predictive HPA signals, so blast radius and drivers stay explainable.
Screens from the live product, with a short note on when you would open each view.
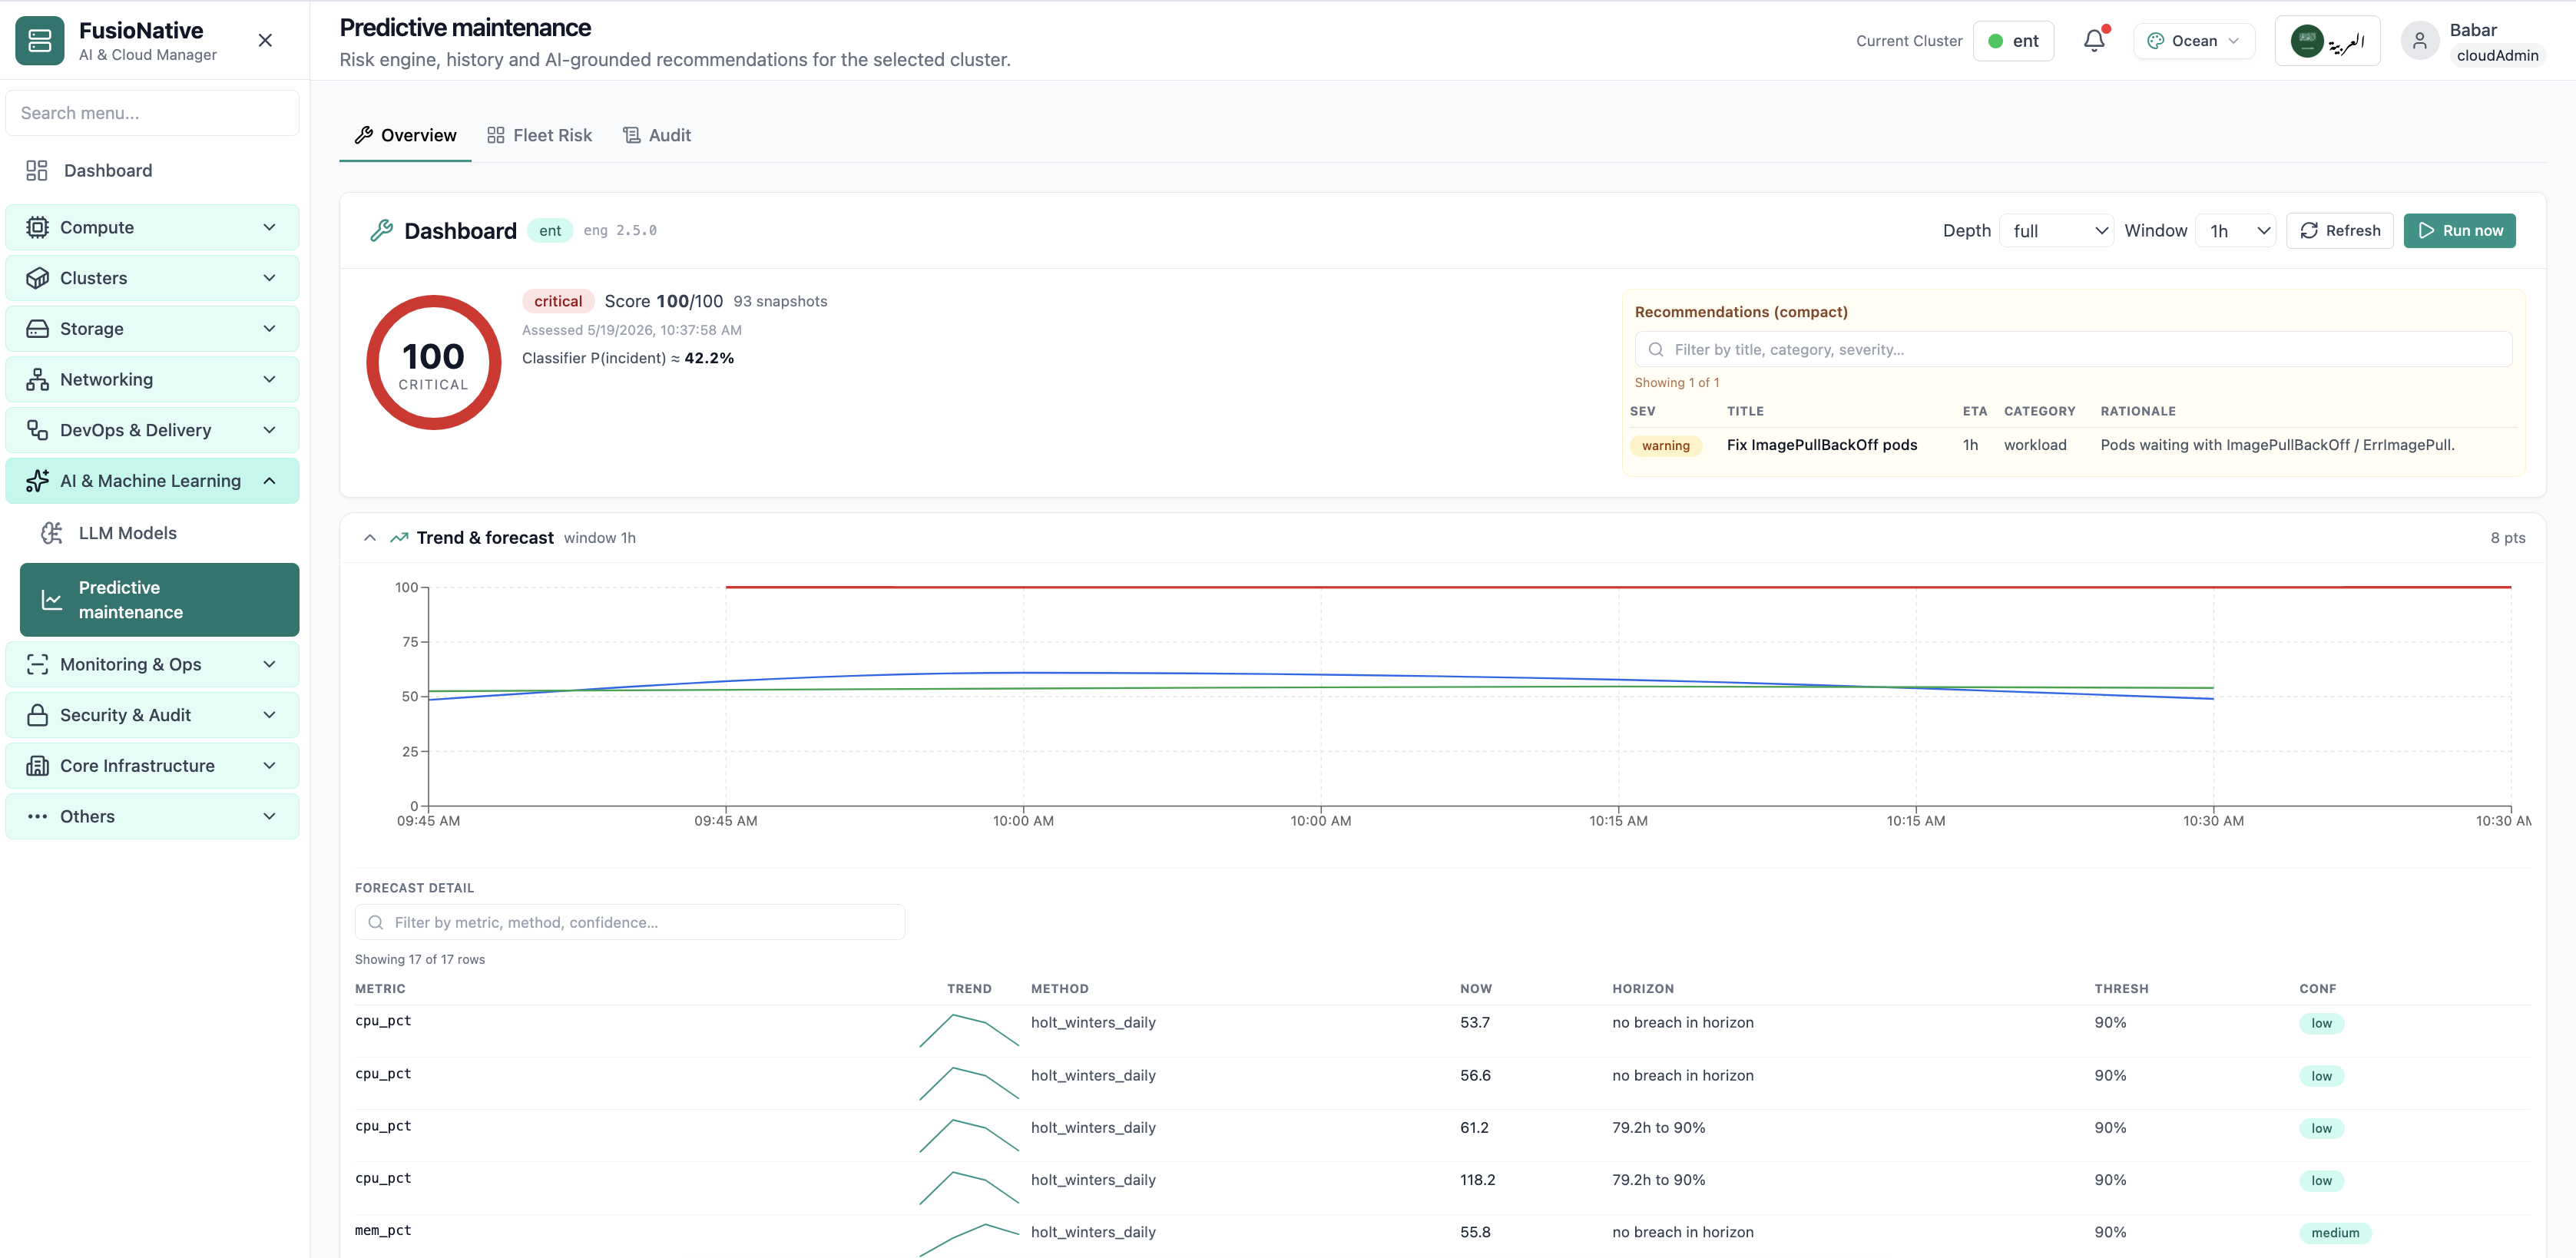
Your starting point for predictive maintenance: KPI cards and charts summarize fleet health, including predictive maintenance risk score and recommendations. Spot drift early, then drill into the tab that explains the root cause.
Click the screenshot to open full size, zoom, and pan.
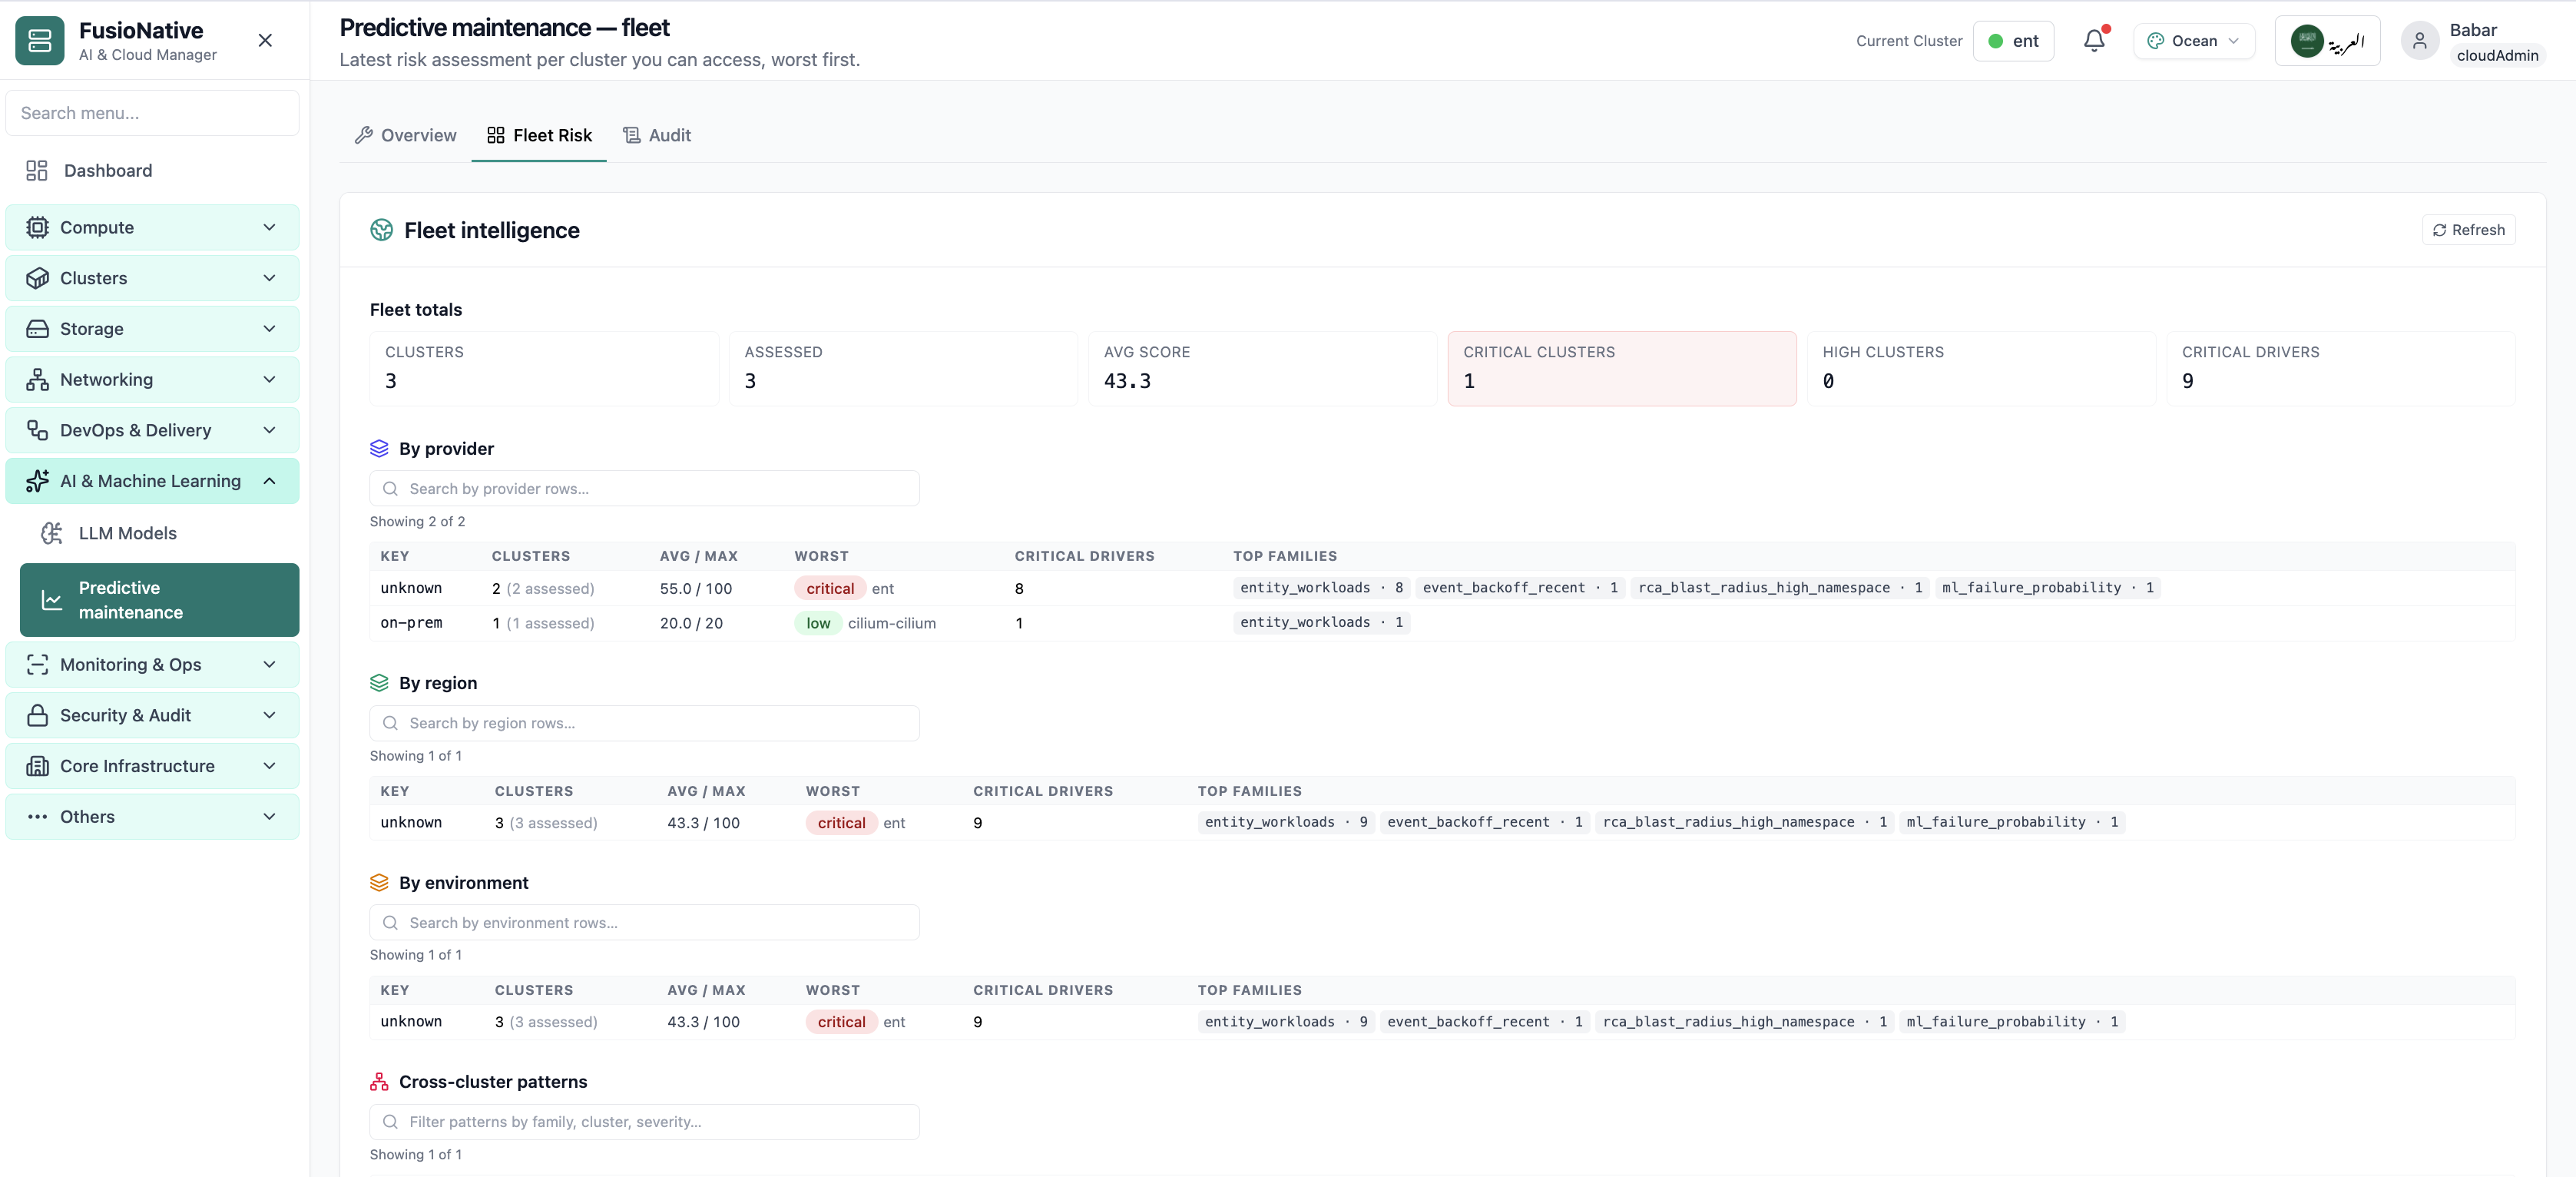
Actionable signals instead of raw logs: fleet risk breakdown by provider and region. Each item ties back to predictive maintenance so owners know what to fix now versus what can wait.
Click the screenshot to open full size, zoom, and pan.
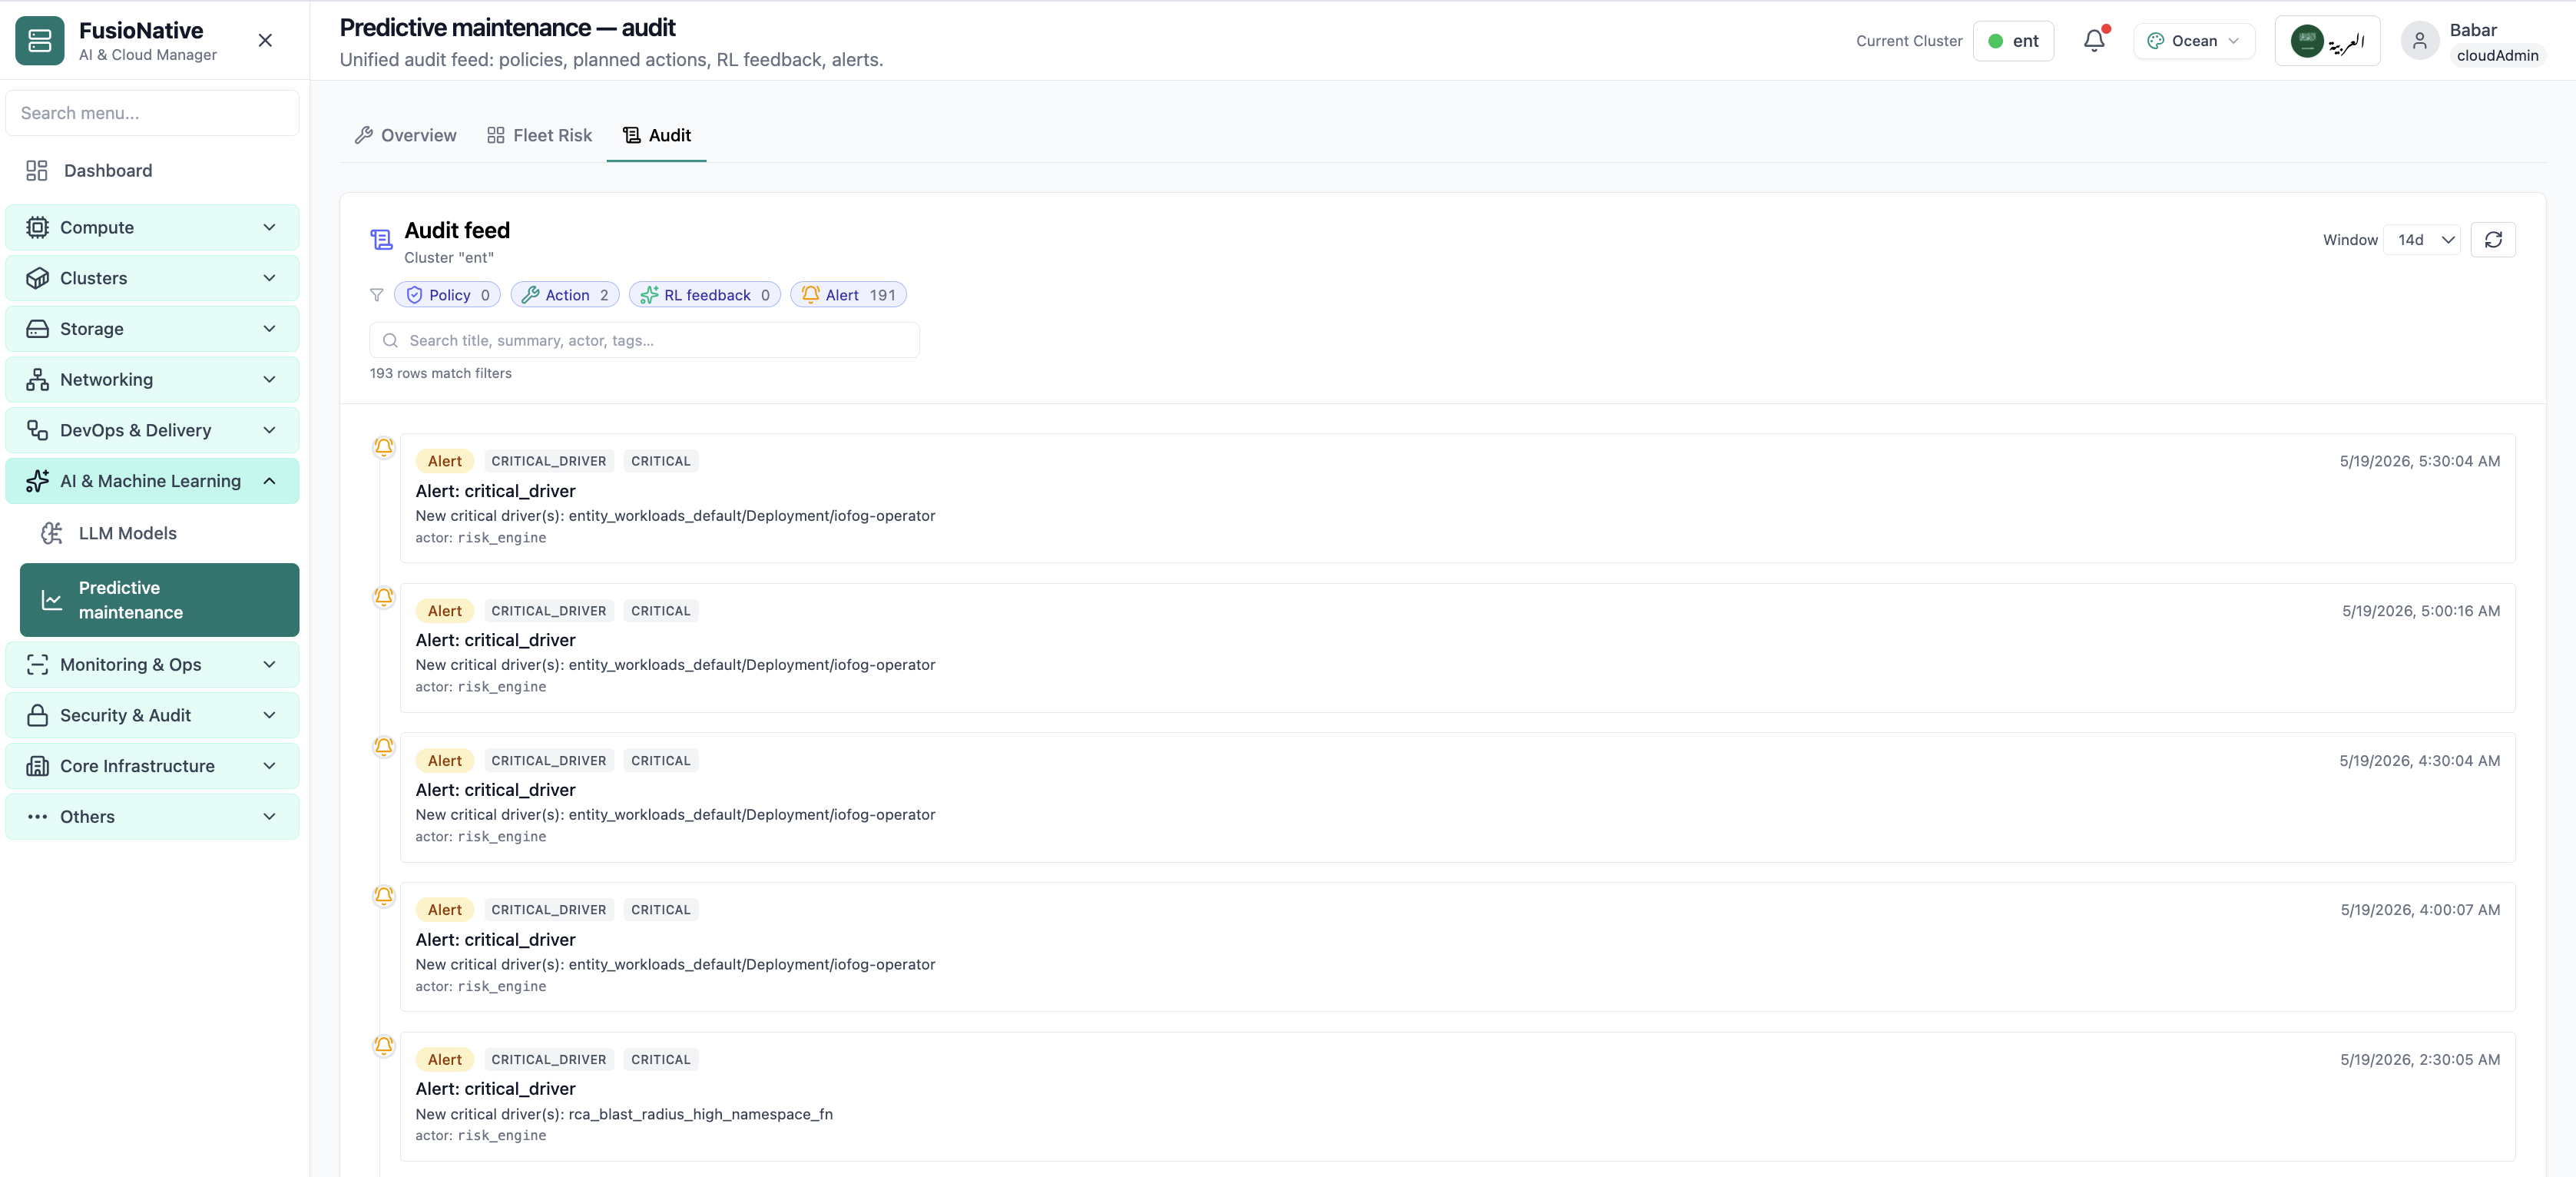
Actionable signals instead of raw logs, predictive maintenance audit alerts. Each item ties back to predictive maintenance so owners know what to fix now versus what can wait.
Click the screenshot to open full size, zoom, and pan.
When risk, RCA, and audit share one narrative, incident reviews start with evidence instead of anecdotes.
Gauge and classifier probability sit next to recommendation copy tied to rationale fields.
Rollups show where to spend the next hour, not every cluster equally.
Policy and RL events land beside alerts so automation stays reviewable.
Run the risk engine from Cloud Admin alongside AI workloads, metrics, and fleet operations.
Get a demo