Observability

Metrics, events, audit, and cluster health in one place

From live Prometheus-backed charts to audit trails and secure operations — manage fleet health, capacity, and compliance without leaving Cloud Admin.

Observability

View Live Metrics

You should not need Grafana, three browser tabs, and a spreadsheet to answer how the fleet is doing. In Cloud Admin, open Monitoring & Ops → Observability for Prometheus-backed charts, inventory, and drill-downs from a quick summary to node- and pod-level detail.

Product walkthrough

Live metrics across your fleet

Screens from the live product, with a short note on when you would open each view.

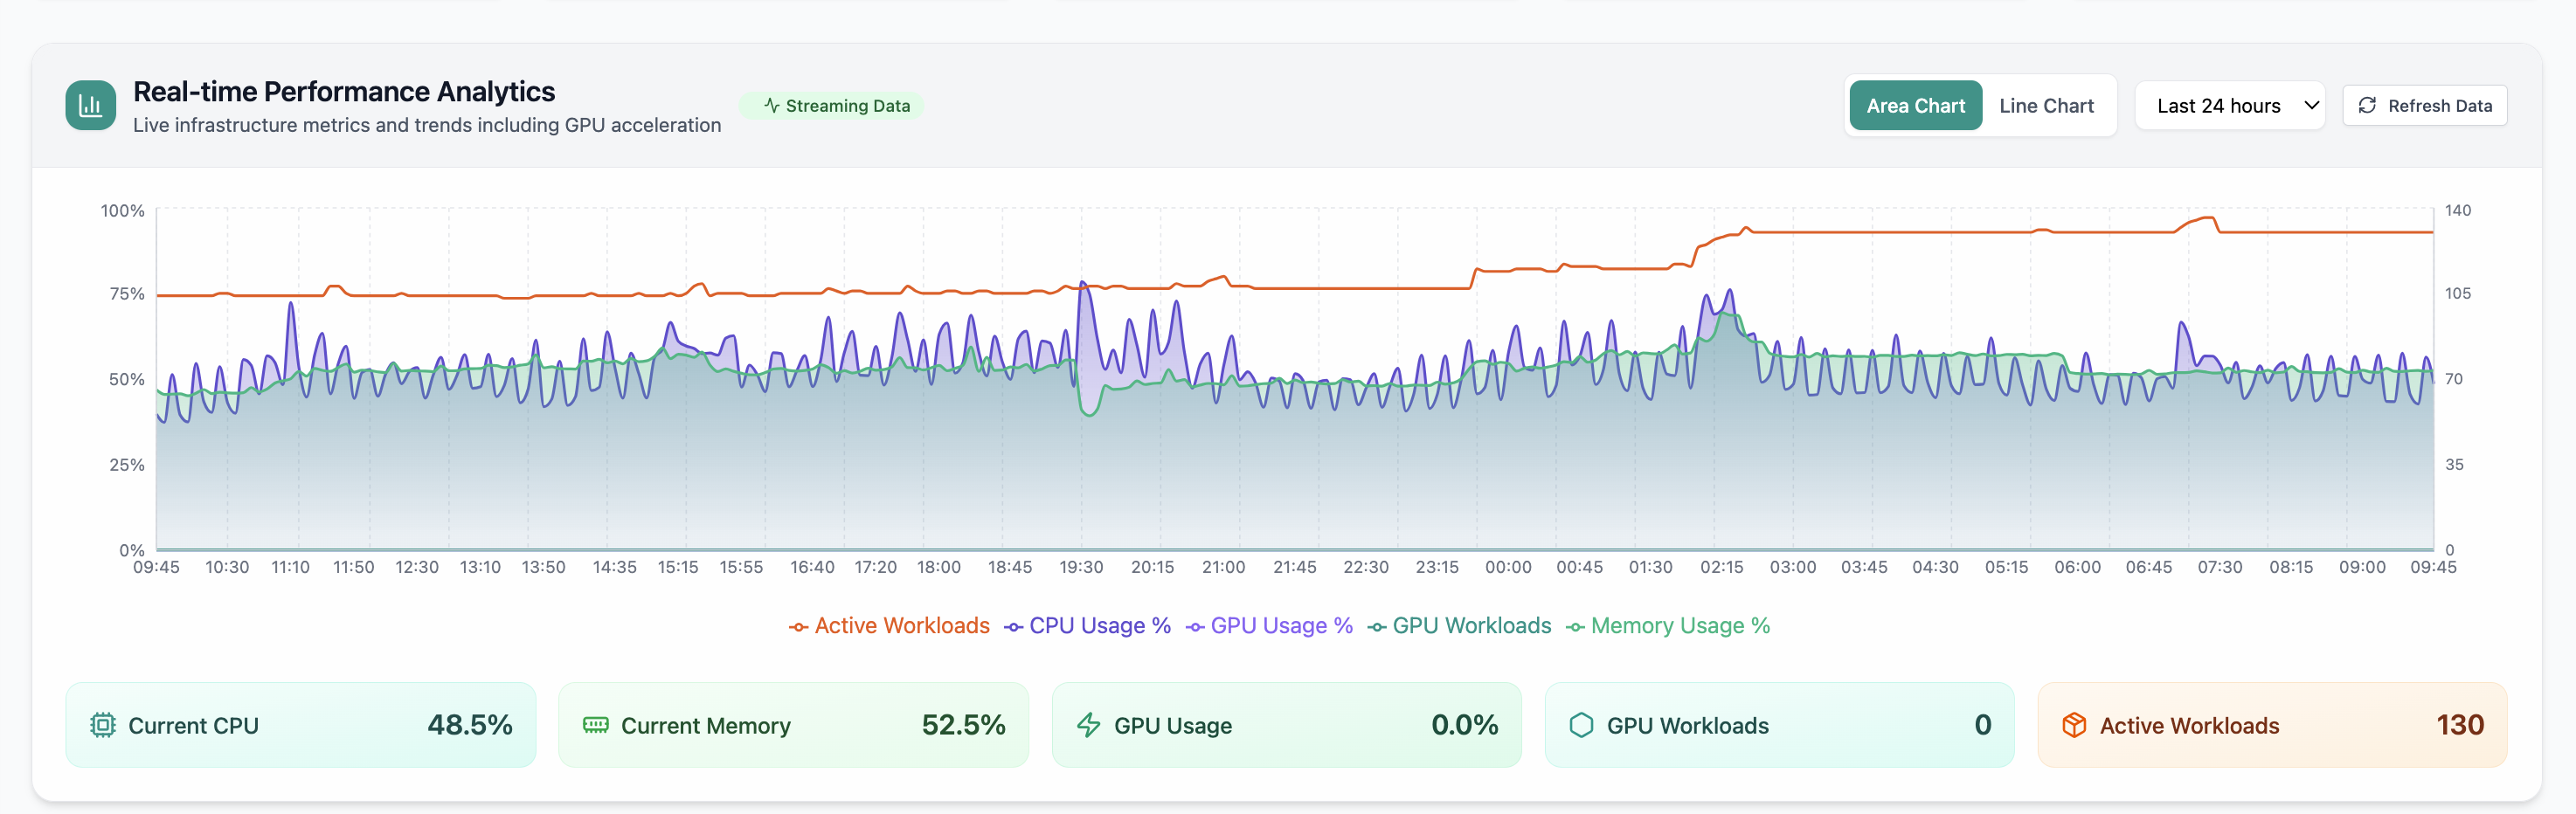
Real-time Performance Analytics area chart for CPU, memory, GPU, and workloads over 24 hours.
01of 12Cloud Admin

Real-time Performance Analytics

Real-time Performance Analytics area chart for CPU, memory, GPU, and workloads over 24 hours.

  • GPU and cluster metrics on one screen
  • Click to zoom in
  • Works alongside the rest of Cloud Admin

Click the screenshot to open full size, zoom, and pan.
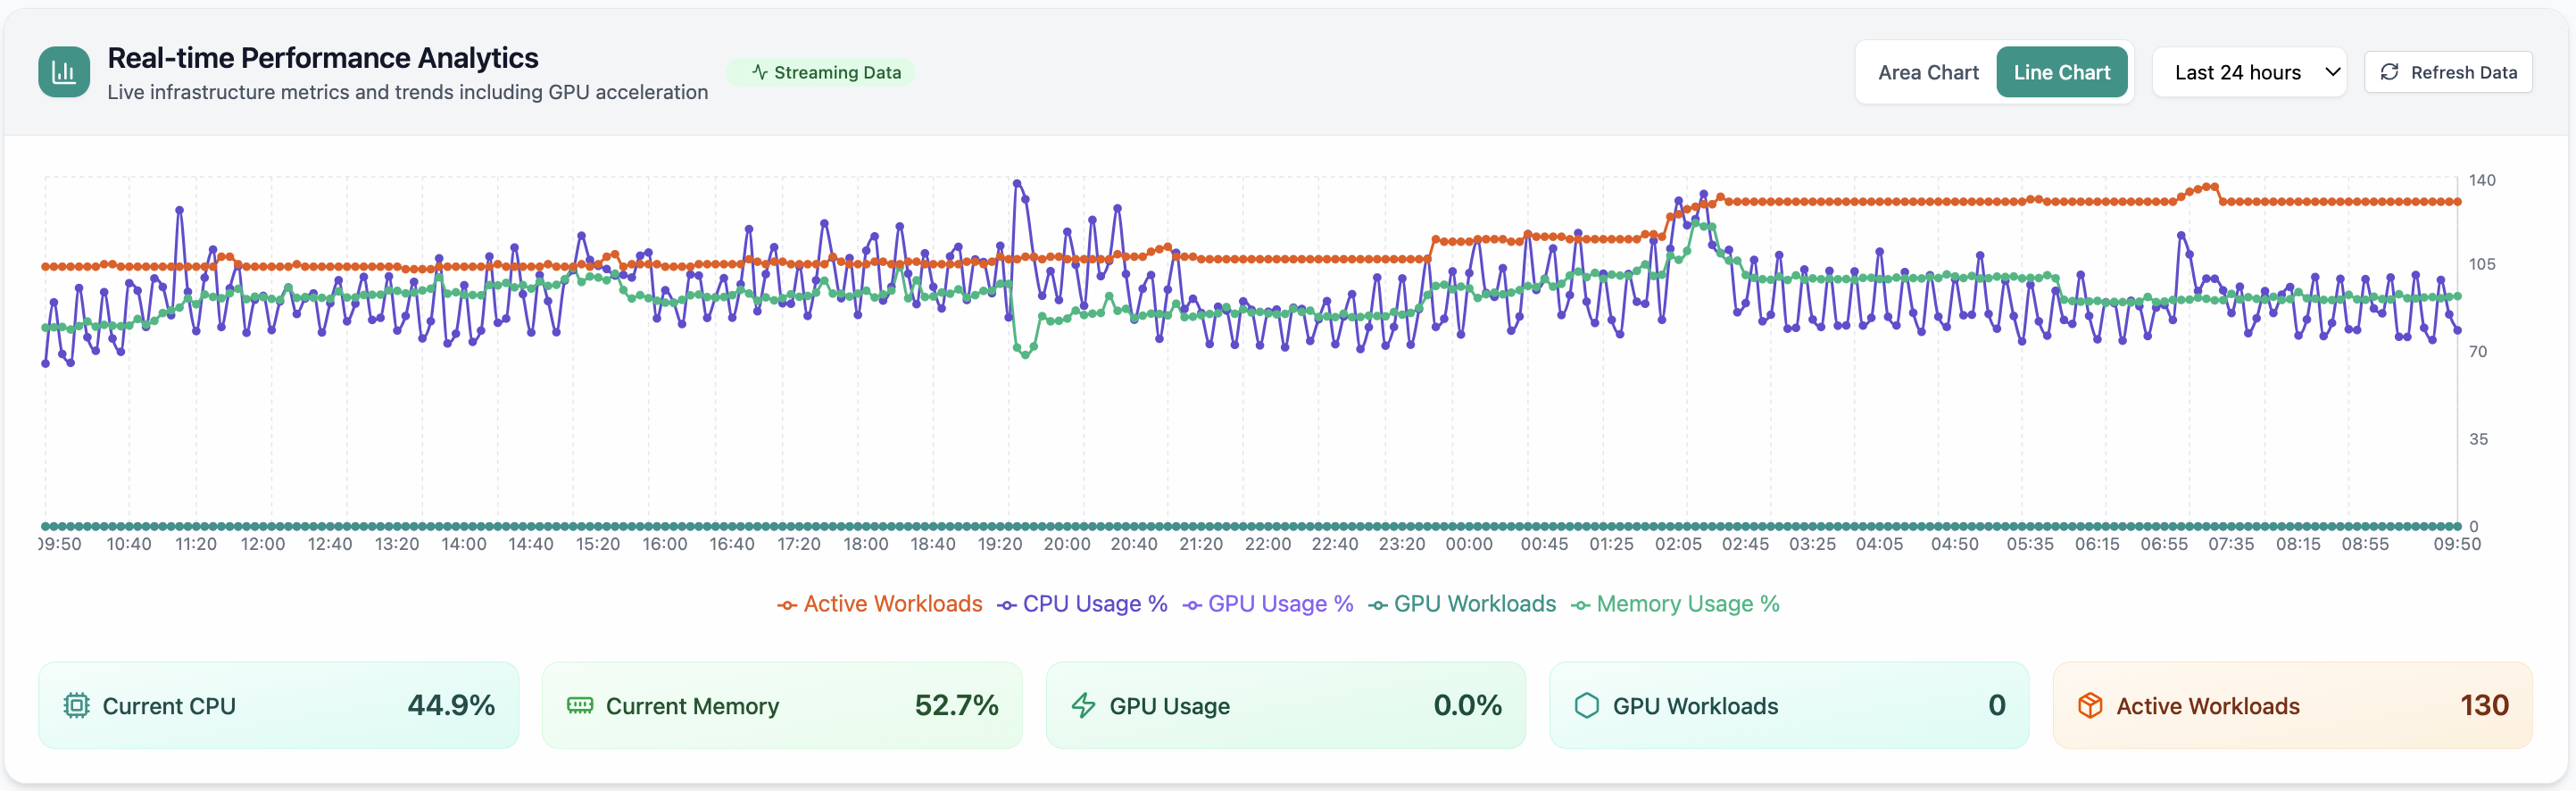
Historical trends reveal whether usage is seasonal, spiking, or creeping, real-time performance analytics line chart with metric summary cards. Pair with capacity planning before users feel pain.
02of 12Cloud Admin

Performance trends

Historical trends reveal whether usage is seasonal, spiking, or creeping, real-time performance analytics line chart with metric summary cards. Pair with capacity planning before users feel pain.

  • 24h+ history shows normal vs abnormal behavior
  • Compare peaks to limits and headroom
  • Export-friendly view for change windows and capacity reviews

Click the screenshot to open full size, zoom, and pan.
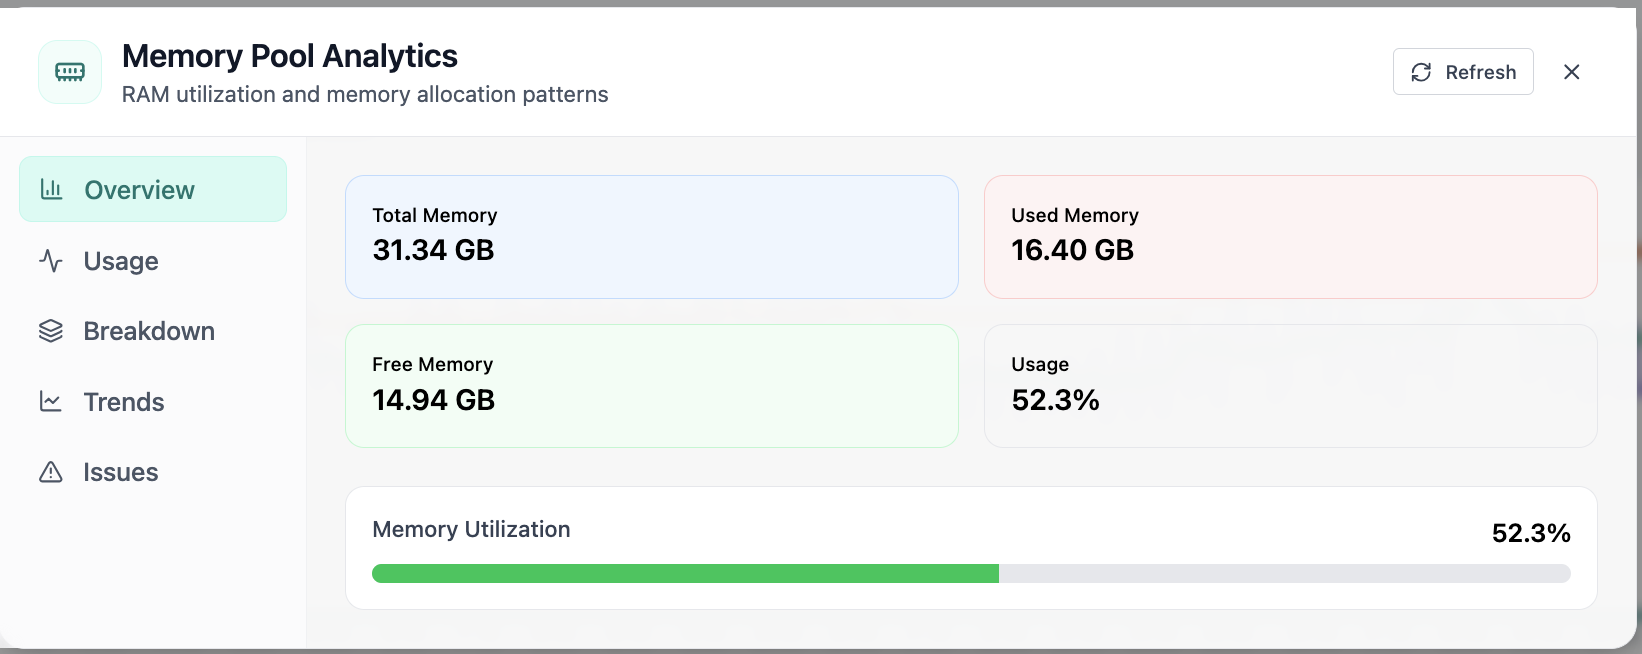
In Memory Pool, the Overview view answers one operational question at a time, memory pool analytics overview with total, used, free memory and utilization. Part of Monitoring workspace; use it when you need evidence before changing limits, scaling, or opening a ticket.
03of 12Cloud Admin

Memory Pool · Overview

In Memory Pool, the Overview view answers one operational question at a time, memory pool analytics overview with total, used, free memory and utilization. Part of Monitoring workspace; use it when you need evidence before changing limits, scaling, or opening a ticket.

  • KPI strip shows the numbers leadership cares about first
  • Charts link utilization to time so you spot spikes quickly
  • One click into deeper tabs when something looks off

Click the screenshot to open full size, zoom, and pan.
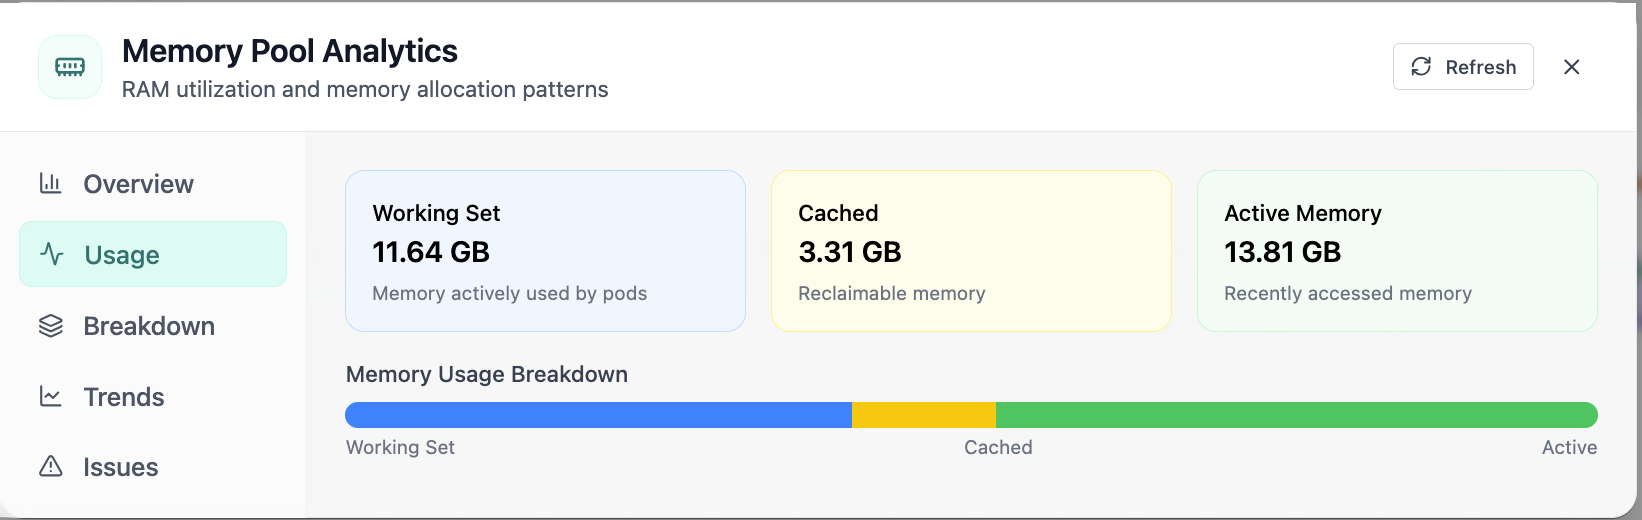
In Memory Pool, the Usage view answers one operational question at a time, memory pool analytics usage tab with working set and cached memory. Part of Monitoring workspace; use it when you need evidence before changing limits, scaling, or opening a ticket.
04of 12Cloud Admin

Memory Pool · Usage

In Memory Pool, the Usage view answers one operational question at a time, memory pool analytics usage tab with working set and cached memory. Part of Monitoring workspace; use it when you need evidence before changing limits, scaling, or opening a ticket.

  • Same layout your operators see in production
  • Click to zoom in
  • Works alongside the rest of Cloud Admin

Click the screenshot to open full size, zoom, and pan.
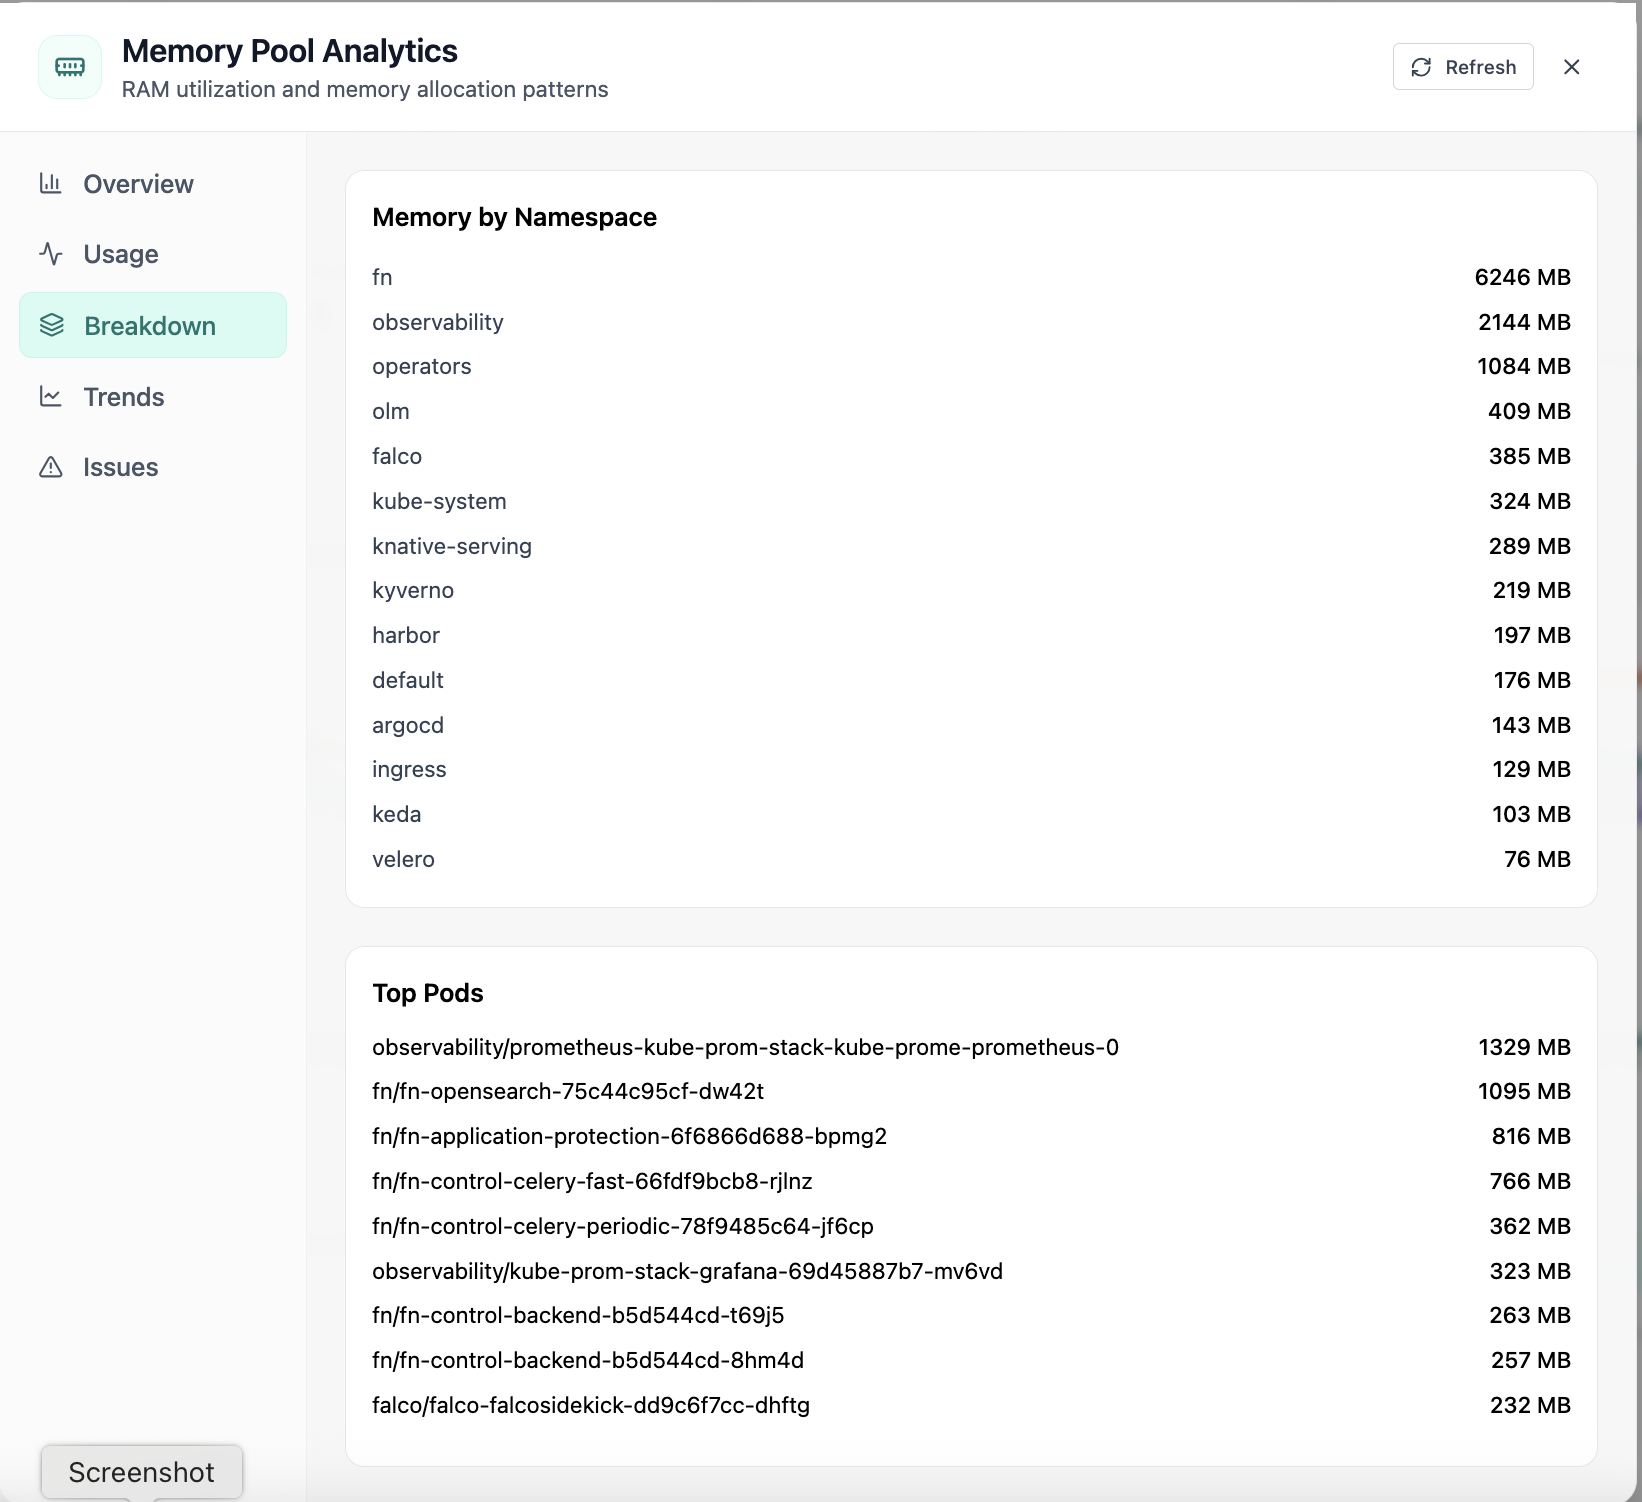
In Memory Pool, the Breakdown view answers one operational question at a time, memory breakdown by namespace and top memory-consuming pods. Part of Monitoring workspace; use it when you need evidence before changing limits, scaling, or opening a ticket.
05of 12Cloud Admin

Memory Pool · Breakdown

In Memory Pool, the Breakdown view answers one operational question at a time, memory breakdown by namespace and top memory-consuming pods. Part of Monitoring workspace; use it when you need evidence before changing limits, scaling, or opening a ticket.

  • Same layout your operators see in production
  • Click to zoom in
  • Works alongside the rest of Cloud Admin

Click the screenshot to open full size, zoom, and pan.
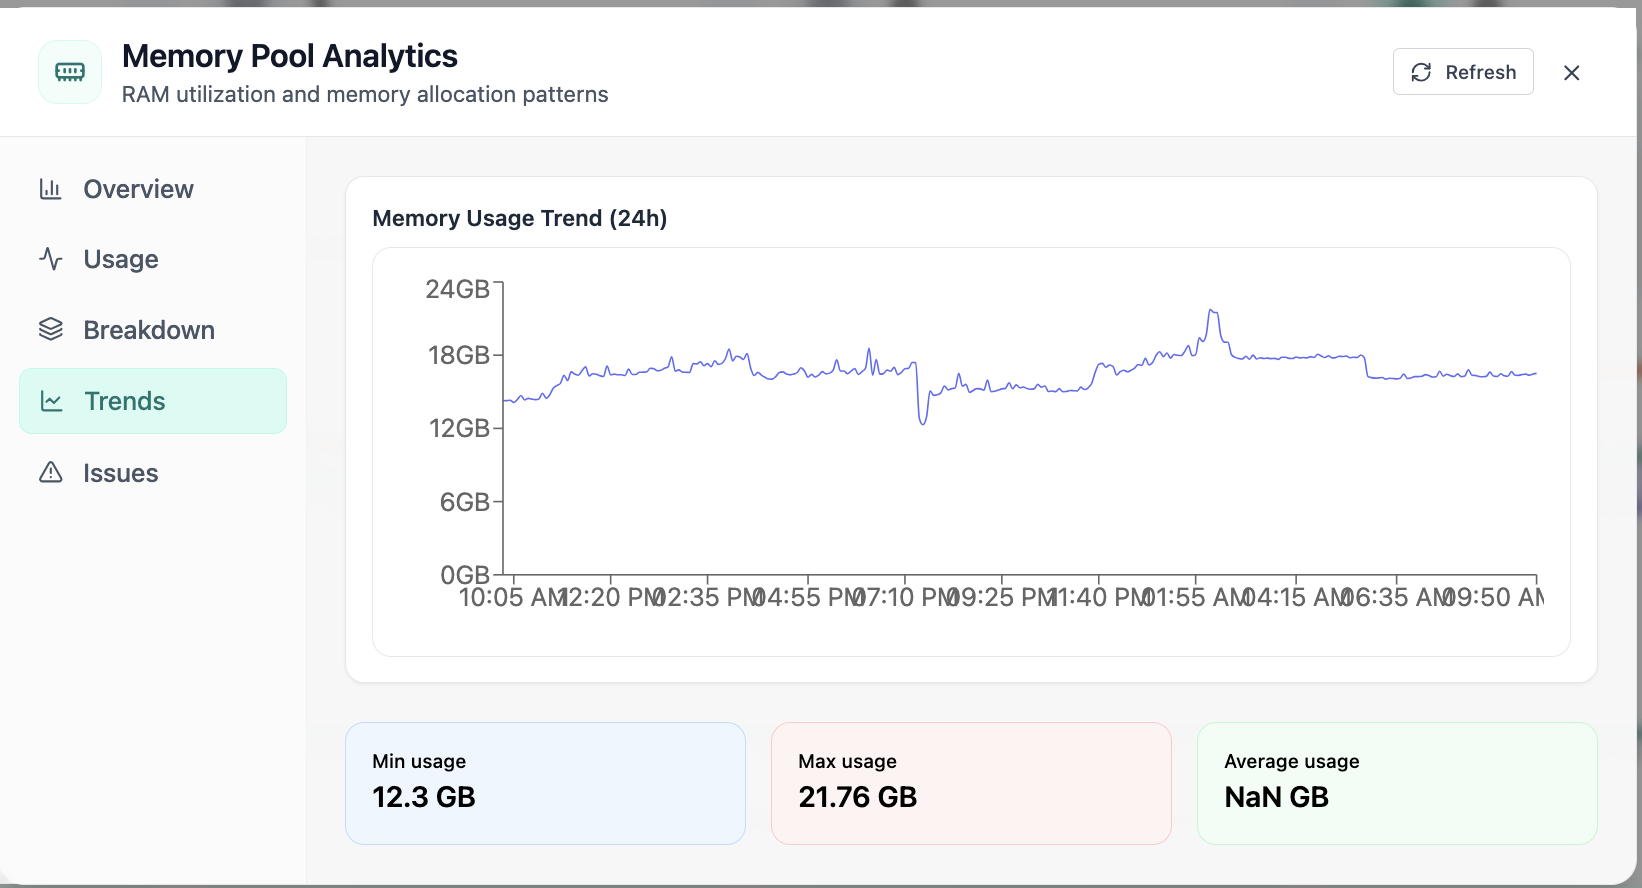
In Memory Pool, the Trends view answers one operational question at a time, 24-hour memory usage trend with min, max, and average. Part of Monitoring workspace; use it when you need evidence before changing limits, scaling, or opening a ticket.
06of 12Cloud Admin

Memory Pool · Trends

In Memory Pool, the Trends view answers one operational question at a time, 24-hour memory usage trend with min, max, and average. Part of Monitoring workspace; use it when you need evidence before changing limits, scaling, or opening a ticket.

  • 24h+ history shows normal vs abnormal behavior
  • Compare peaks to limits and headroom
  • Export-friendly view for change windows and capacity reviews

Click the screenshot to open full size, zoom, and pan.

In Memory Pool, the Issues view answers one operational question at a time, memory health issues tab with pressure and oom checks. Part of Monitoring workspace; use it when you need evidence before changing limits, scaling, or opening a ticket.
07of 12Cloud Admin

Memory Pool · Issues

In Memory Pool, the Issues view answers one operational question at a time, memory health issues tab with pressure and oom checks. Part of Monitoring workspace; use it when you need evidence before changing limits, scaling, or opening a ticket.

  • Problems ranked so the noisiest failures surface first
  • Enough context to assign an owner without opening five tools
  • Clear next step: scale, restart, patch quota, or escalate

Click the screenshot to open full size, zoom, and pan.

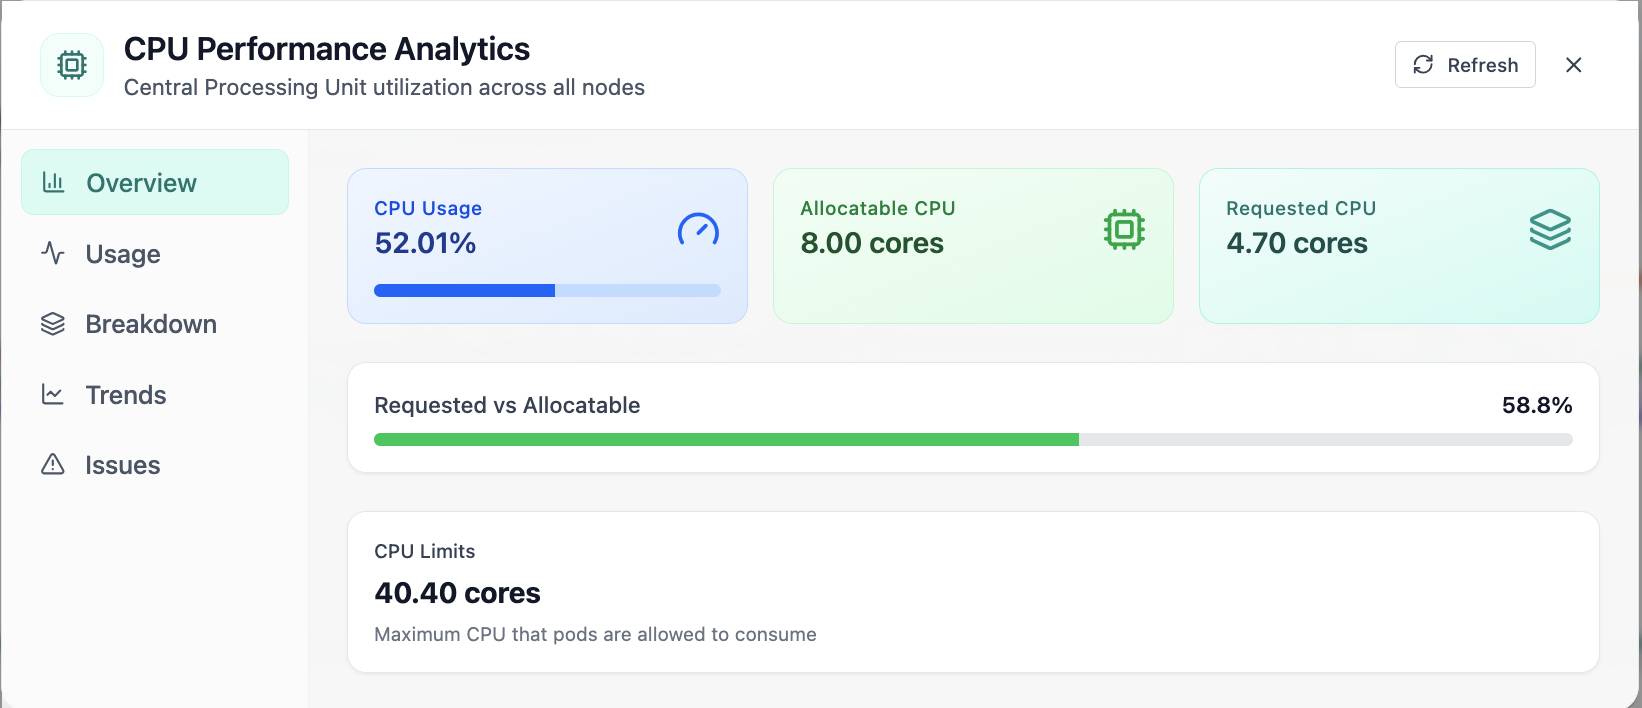
In CPU Performance, the Overview view answers one operational question at a time, cpu performance analytics overview with usage, cores, and limits. Part of Monitoring workspace; use it when you need evidence before changing limits, scaling, or opening a ticket.
08of 12Cloud Admin

CPU Performance · Overview

In CPU Performance, the Overview view answers one operational question at a time, cpu performance analytics overview with usage, cores, and limits. Part of Monitoring workspace; use it when you need evidence before changing limits, scaling, or opening a ticket.

  • KPI strip shows the numbers leadership cares about first
  • Charts link utilization to time so you spot spikes quickly
  • One click into deeper tabs when something looks off

Click the screenshot to open full size, zoom, and pan.

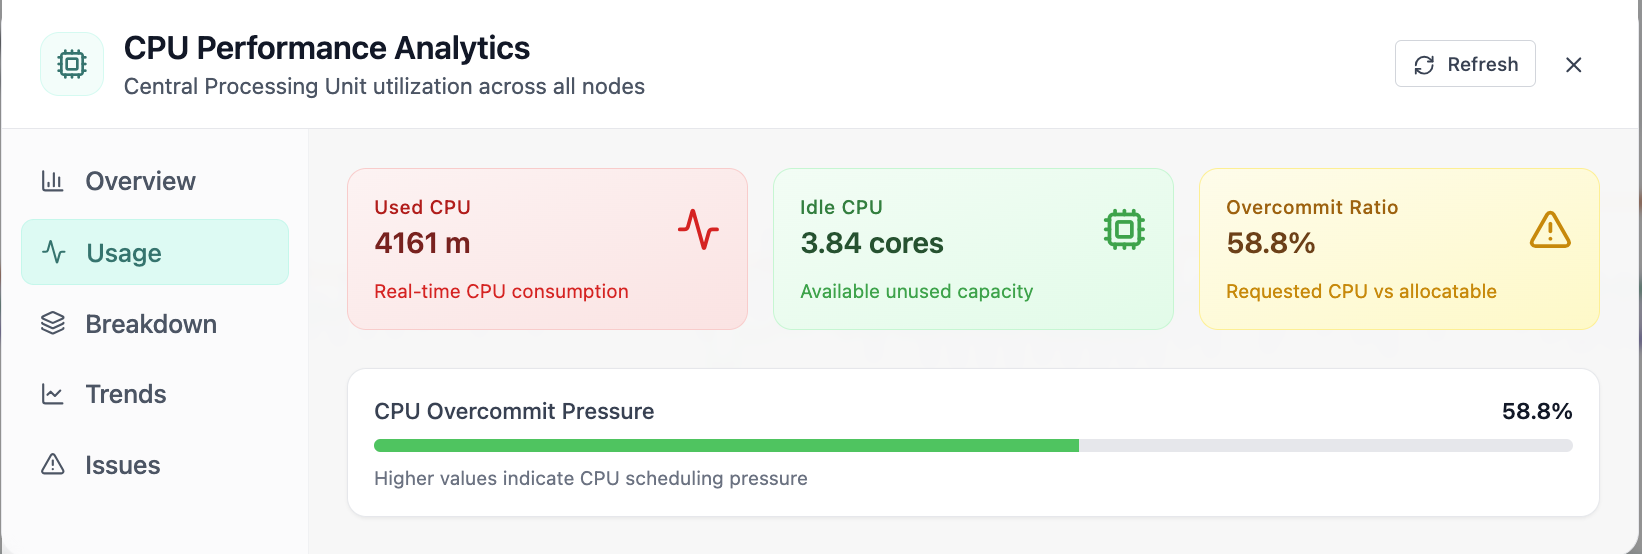
In CPU Performance, the Usage view answers one operational question at a time, cpu usage tab with used, idle cpu and overcommit ratio. Part of Monitoring workspace; use it when you need evidence before changing limits, scaling, or opening a ticket.
09of 12Cloud Admin

CPU Performance · Usage

In CPU Performance, the Usage view answers one operational question at a time, cpu usage tab with used, idle cpu and overcommit ratio. Part of Monitoring workspace; use it when you need evidence before changing limits, scaling, or opening a ticket.

  • Same layout your operators see in production
  • Click to zoom in
  • Works alongside the rest of Cloud Admin

Click the screenshot to open full size, zoom, and pan.
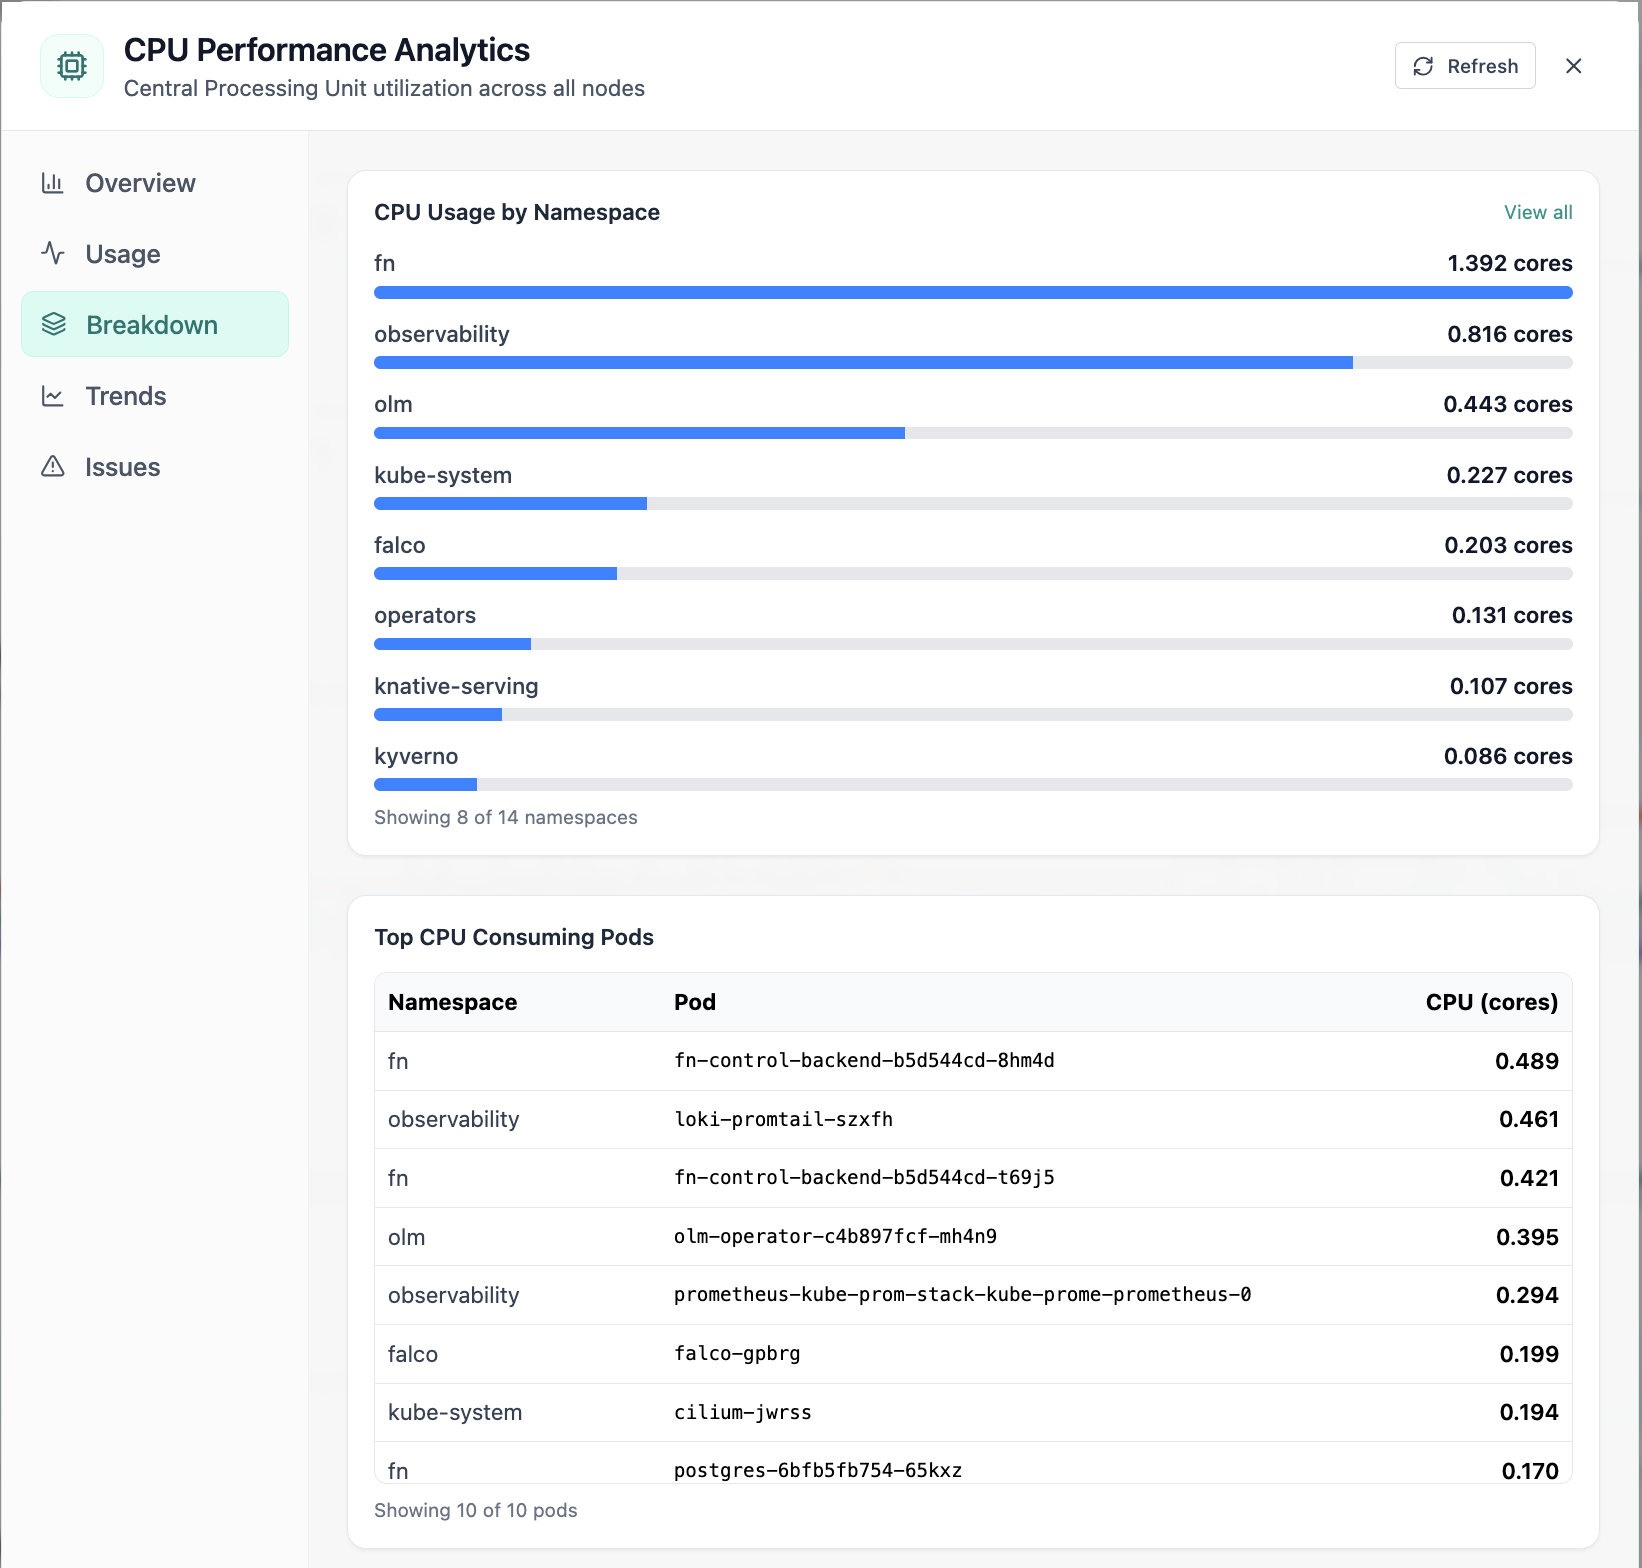
In CPU Performance, the Breakdown view answers one operational question at a time, cpu breakdown by namespace and top cpu pods. Part of Monitoring workspace; use it when you need evidence before changing limits, scaling, or opening a ticket.
10of 12Cloud Admin

CPU Performance · Breakdown

In CPU Performance, the Breakdown view answers one operational question at a time, cpu breakdown by namespace and top cpu pods. Part of Monitoring workspace; use it when you need evidence before changing limits, scaling, or opening a ticket.

  • Same layout your operators see in production
  • Click to zoom in
  • Works alongside the rest of Cloud Admin

Click the screenshot to open full size, zoom, and pan.
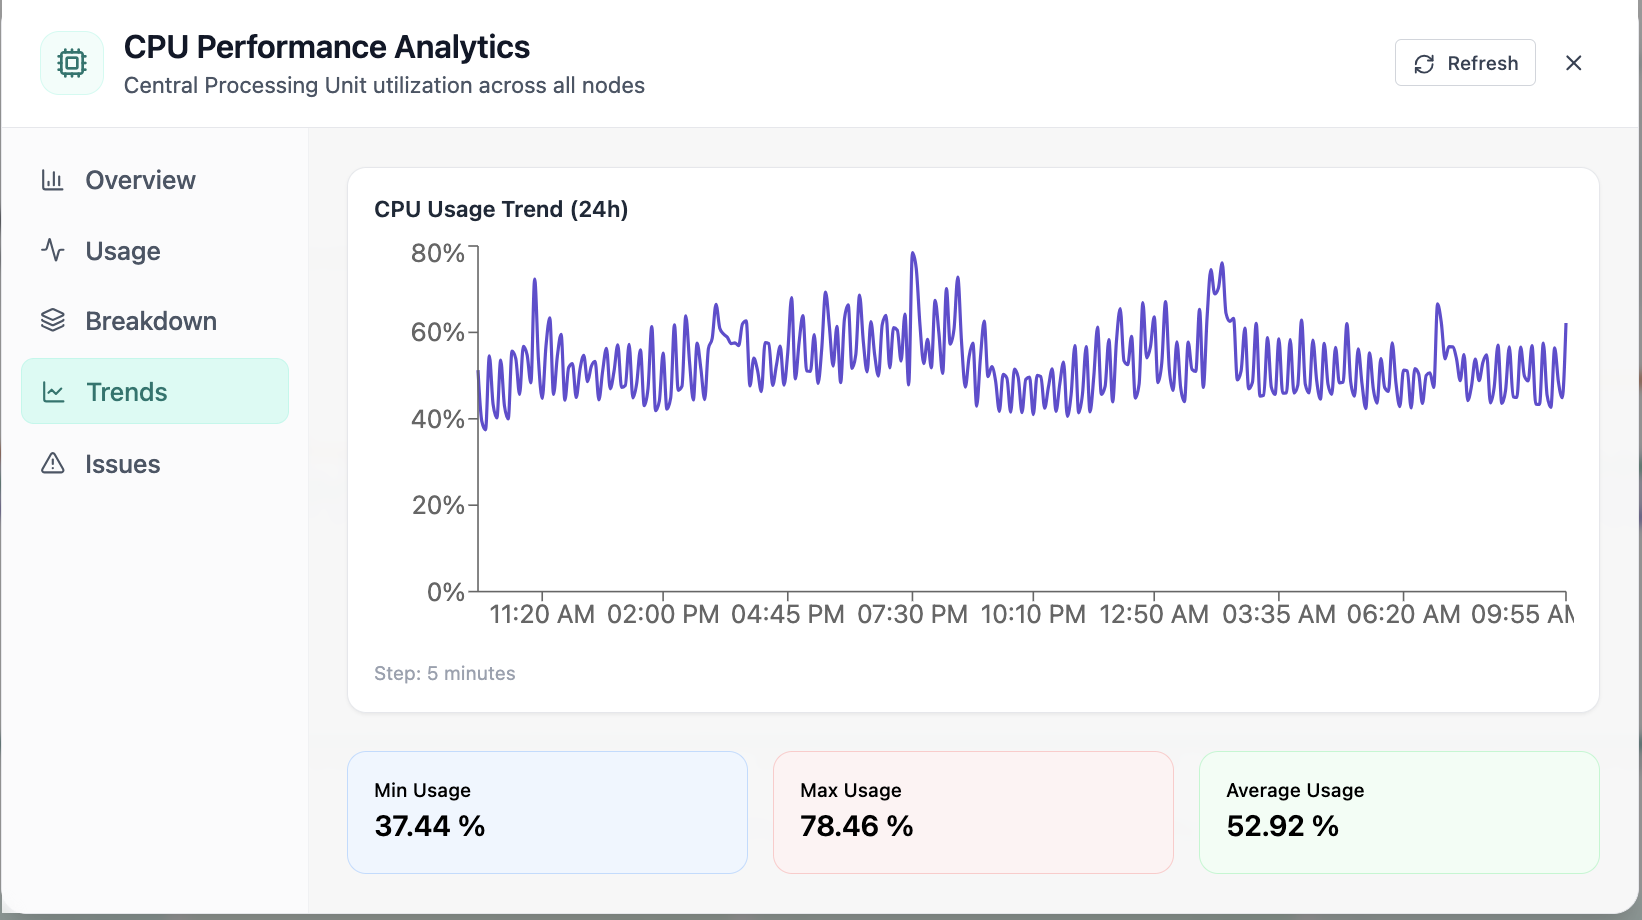
In CPU Performance, the Trends view answers one operational question at a time, 24-hour cpu usage trend chart and statistics. Part of Monitoring workspace; use it when you need evidence before changing limits, scaling, or opening a ticket.
11of 12Cloud Admin

CPU Performance · Trends

In CPU Performance, the Trends view answers one operational question at a time, 24-hour cpu usage trend chart and statistics. Part of Monitoring workspace; use it when you need evidence before changing limits, scaling, or opening a ticket.

  • 24h+ history shows normal vs abnormal behavior
  • Compare peaks to limits and headroom
  • Export-friendly view for change windows and capacity reviews

Click the screenshot to open full size, zoom, and pan.

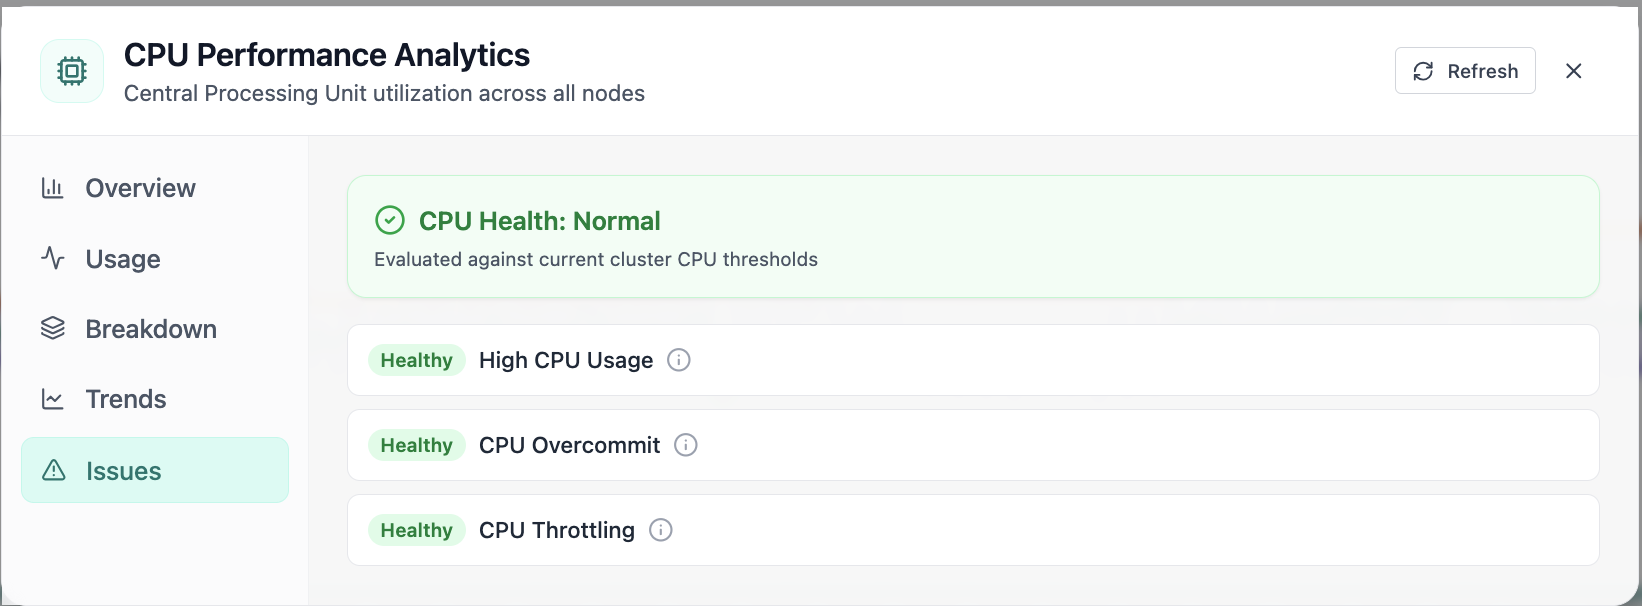
In CPU Performance, the Issues view answers one operational question at a time, cpu health checks for usage, overcommit, and throttling. Part of Monitoring workspace; use it when you need evidence before changing limits, scaling, or opening a ticket.
12of 12Cloud Admin

CPU Performance · Issues

In CPU Performance, the Issues view answers one operational question at a time, cpu health checks for usage, overcommit, and throttling. Part of Monitoring workspace; use it when you need evidence before changing limits, scaling, or opening a ticket.

  • Problems ranked so the noisiest failures surface first
  • Enough context to assign an owner without opening five tools
  • Clear next step: scale, restart, patch quota, or escalate

Click the screenshot to open full size, zoom, and pan.

Deep dive

From posture check to root cause, without leaving Cloud Admin

Fleet KPIs, saturation charts, flow telemetry, and Prometheus-backed alerts share one investigation cadence: confirm scope, isolate the layer that moved, validate mitigation.

Throughput & top talkers

Slice traffic by cluster total, namespace, node NIC, or workload; correlate spikes with pod-level tables instead of tcpdump theater.

CPU & memory forensics

Allocation donuts, 24h trends, namespace and node breakdowns, plus ranked pods, ideal when HPA metrics disagree with user-visible latency.

Alerts grounded in metrics

Alert summaries pair severity counts with the charts that explain them. Fewer circular conversations about “whether Prometheus fired.”

Infrastructure tables inline

Nodes, namespaces, controllers, ConfigMaps, Secrets, NetworkPolicies, and Services appear beside charts, no separate CMDB hunt mid-incident.

See Monitoring & Ops on your clusters

Walk the Observability workspace with your metrics, or explore use cases on the homepage.

Get Demo

Monitoring & Ops

Capacity Planning

In Cloud Admin, Monitoring & Ops → Capacity Planning turns Prometheus signals and Kubernetes inventory into snapshots, forecasts, and fleet-wide roll-ups, so finance and platform teams agree before spend or outages force the conversation.

Product walkthrough

See it in Cloud Admin

Screens from the live product, with a short note on when you would open each view.

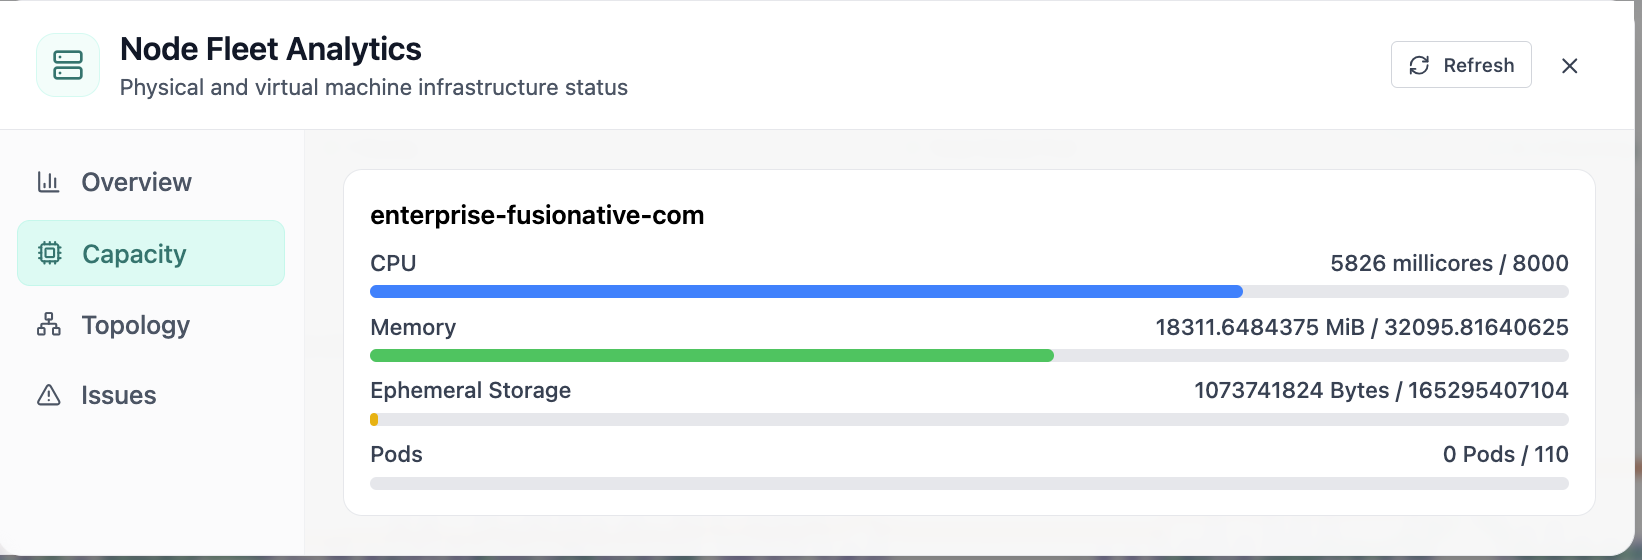
Node fleet capacity for CPU, memory, storage, and pods.
01of 02Cloud Admin

Node Capacity

Node fleet capacity for CPU, memory, storage, and pods.

  • Same layout your operators see in production
  • Click to zoom in
  • Works alongside the rest of Cloud Admin

Click the screenshot to open full size, zoom, and pan.
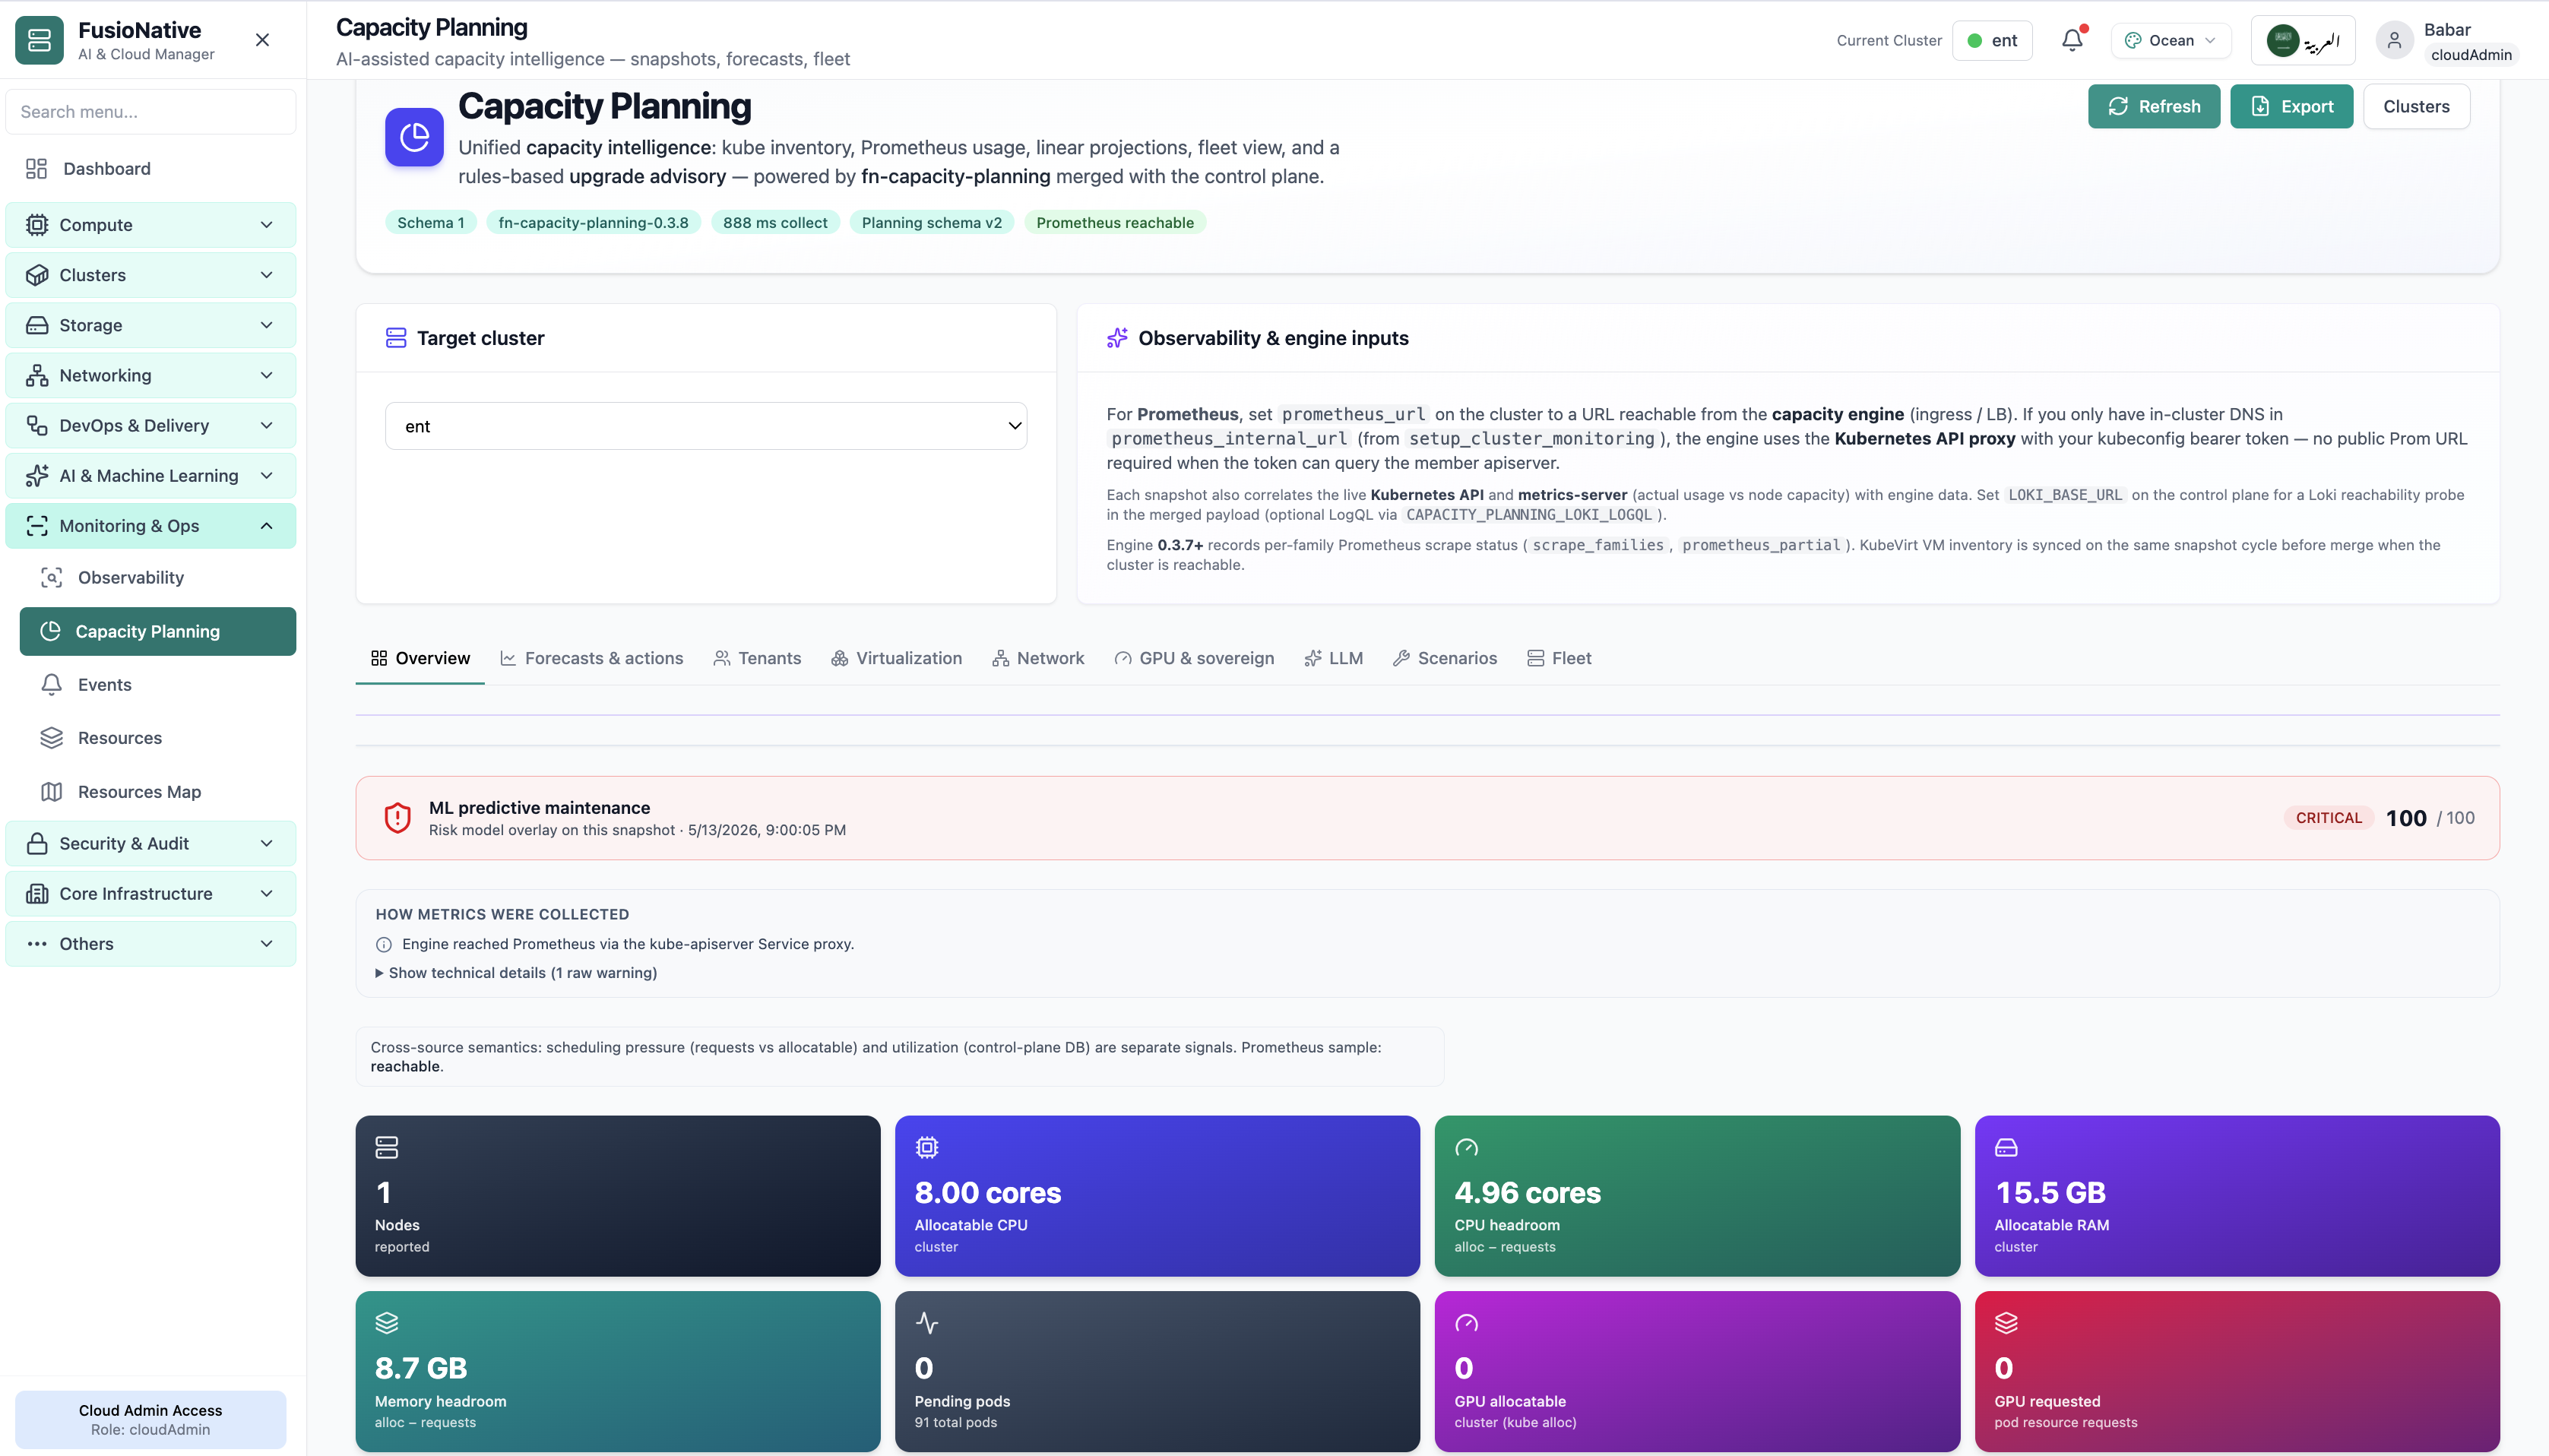
Capacity planning with headroom and predictive risk overlay.
02of 02Cloud Admin

Capacity Planning

Capacity planning with headroom and predictive risk overlay.

  • Same layout your operators see in production
  • Click to zoom in
  • Works alongside the rest of Cloud Admin

Click the screenshot to open full size, zoom, and pan.
Planning narrative

Give Finance and Platform the same denominators

When capacity tiles, forecasts, and tenant overlays reference identical Prometheus series and Kubernetes objects, debates shift from “whose export is right” to “which scenario do we fund.”

Forecasts that cite inputs

Forecasts & actions stay grounded because collectors, schemas, and Prometheus health are visible, not hidden jobs in another portal.

Fleet without flattening nuance

Fleet and scenario tabs compare clusters without stripping virtualization, network, or LLM-specific overlays.

Tenant fairness

Dedicated tenant lenses translate raw cluster metrics into chargeback-ready narratives.

Monitoring & Ops

Cluster Events

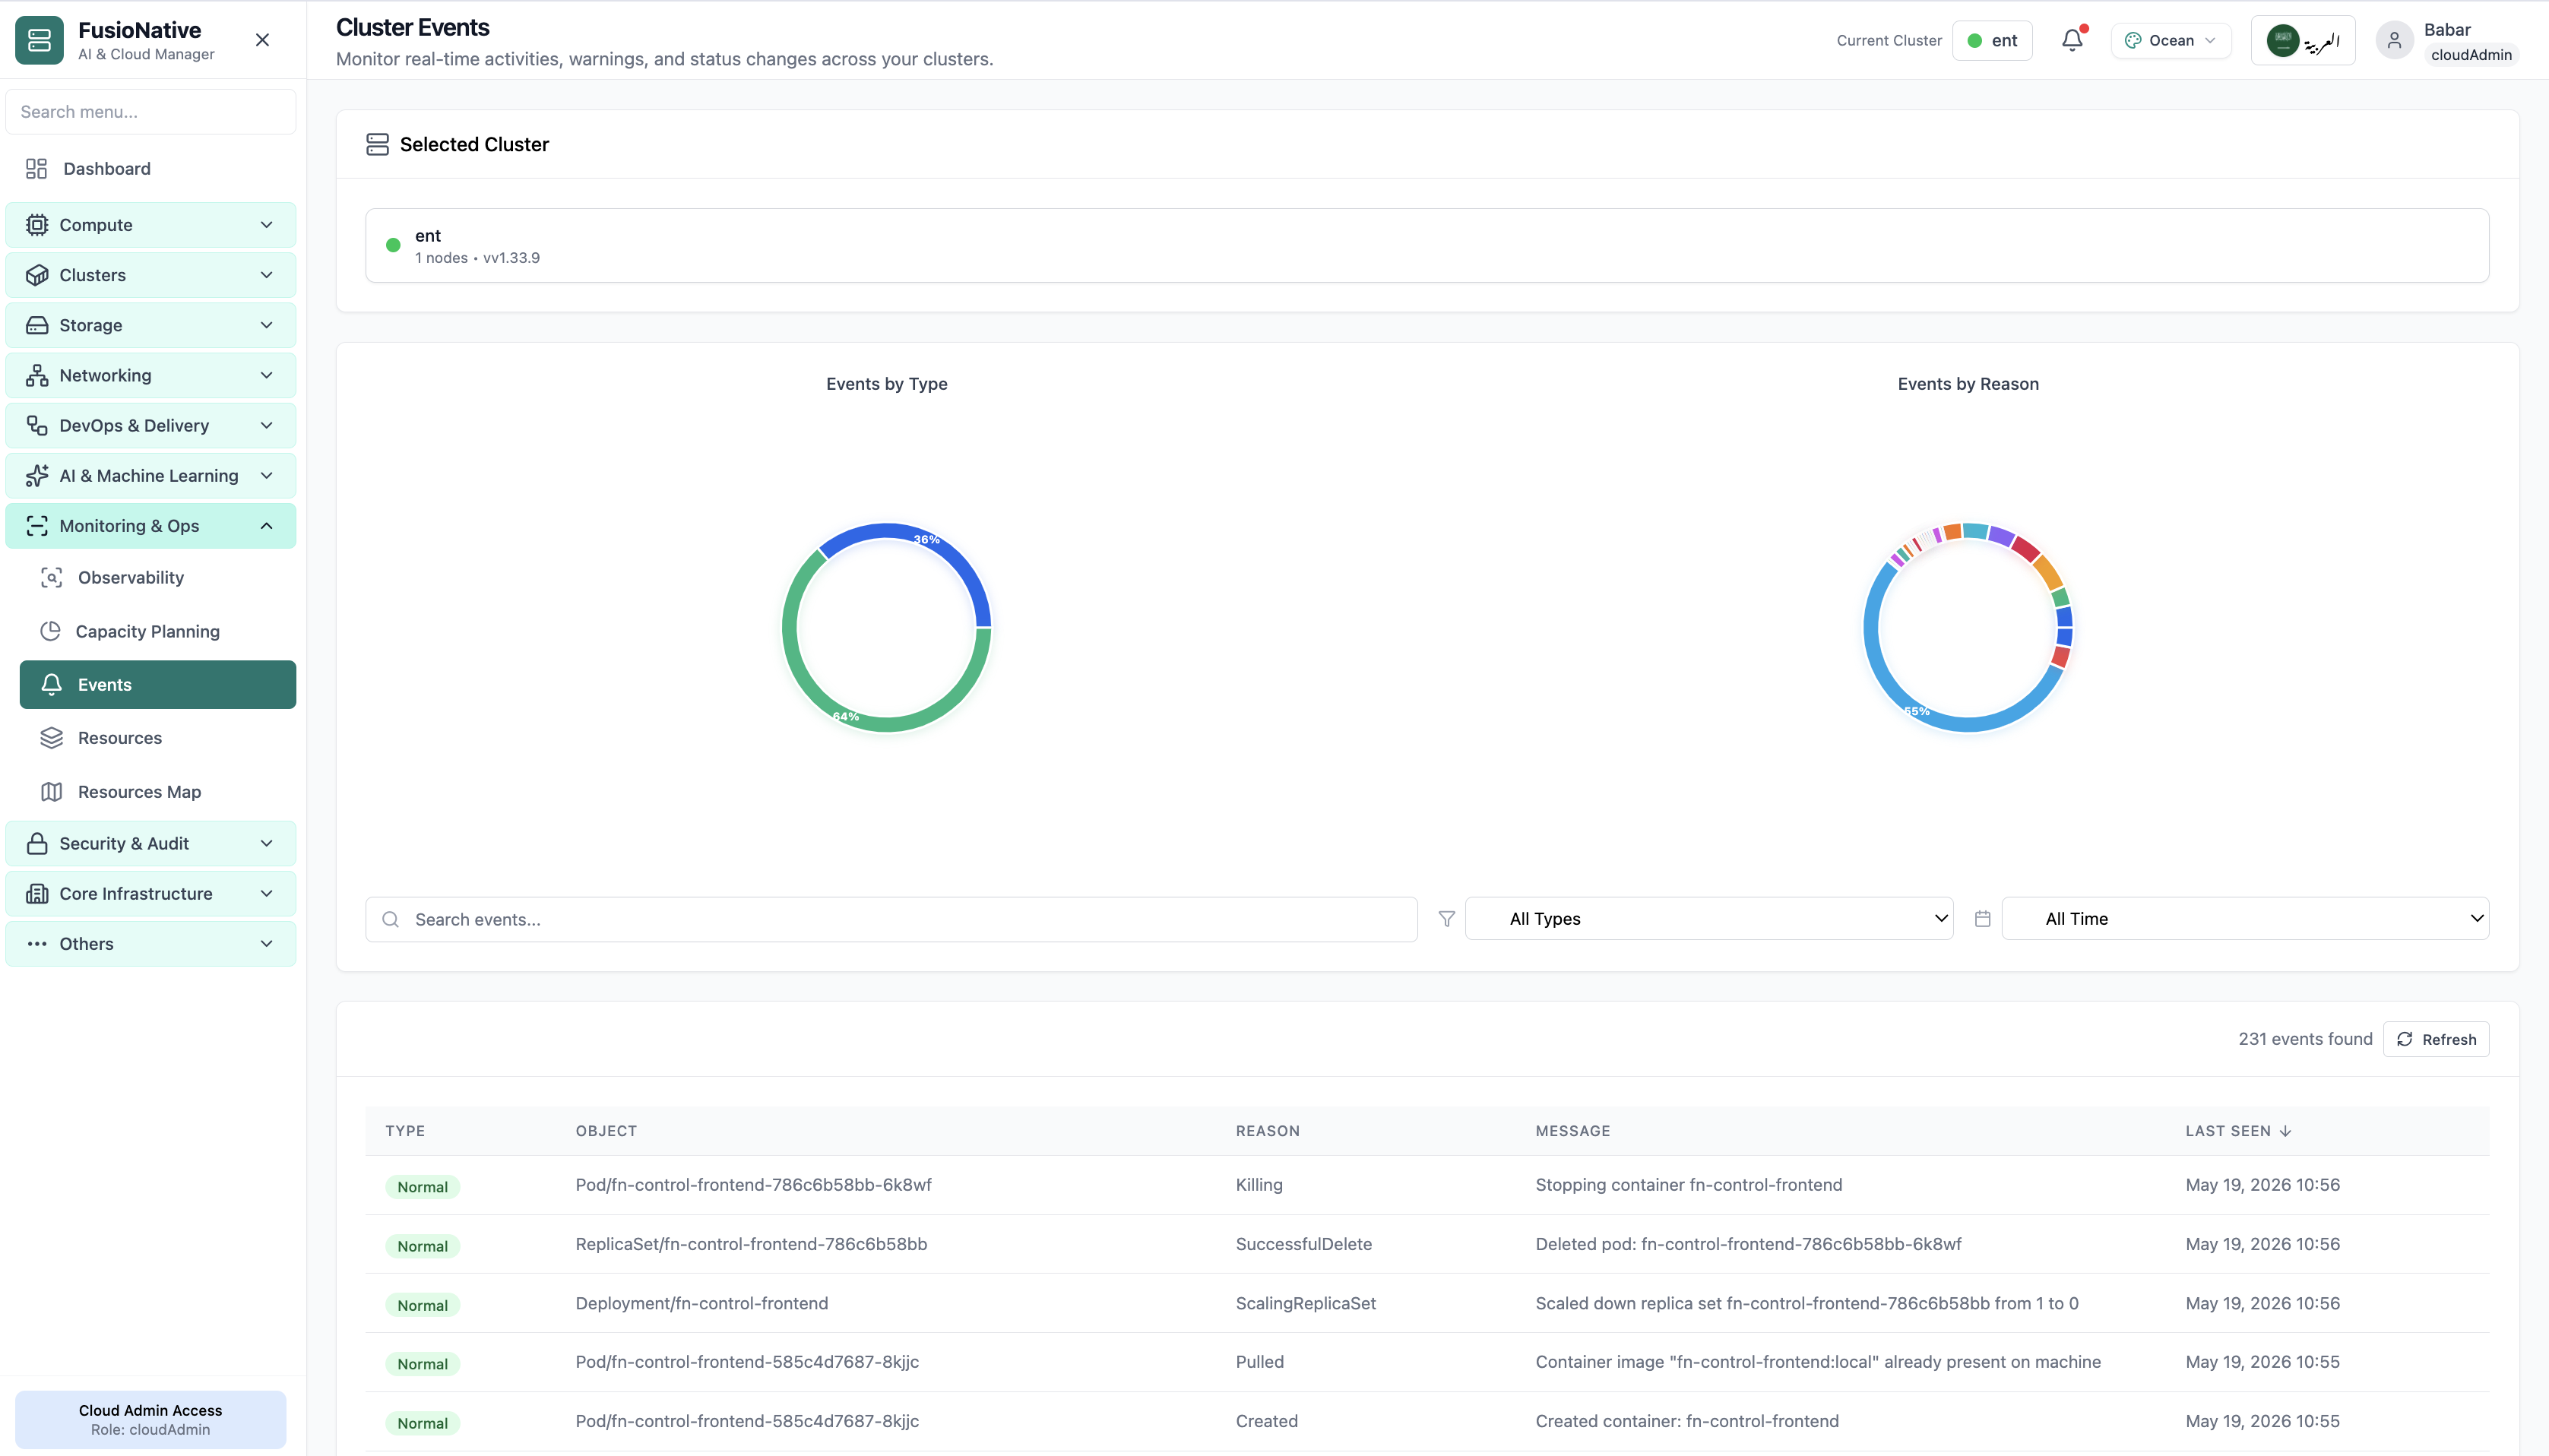
Open Monitoring & Ops → Events to watch Kubernetes events as they happen: cluster-scoped context, type/reason distributions, rich filters, and a searchable table, ideal when logs are noisy but the API surface tells the truth.

Product walkthrough

See it in Cloud Admin

Screens from the live product, with a short note on when you would open each view.

Cluster events charts and searchable event table.
01of 01Cloud Admin

Cluster Events

Cluster events charts and searchable event table.

  • Same layout your operators see in production
  • Click to zoom in
  • Works alongside the rest of Cloud Admin

Click the screenshot to open full size, zoom, and pan.
Incident tempo

Turn Kubernetes chatter into coordinated response

Events become actionable when everyone sees the same Normal/Warning profile, reasons cluster visibly, and filters isolate the blast radius, without copying kubectl output into chat.

Bridge-ready summaries

Donut charts give executives the headline mix while engineers stay in the detailed table.

Forensics without log roulette

Warning badges and reasons isolate kubelet and scheduler narratives before you grep terabytes of stdout.

Same cluster picker

Switch clusters without breaking context, Monitoring & Ops routes stay consistent.

Monitoring & Ops

Cluster Resources

Under Monitoring & Ops → Resources (and the FN K8s Dashboard entry point), Cloud Admin shows one cluster up front: version and node count in the header, a KPI strip for CPU, memory, pods, namespaces, and readiness, then capacity vs usage charts and per-node cards with pod slots, CPU/memory/storage bars, and paths to details or console.

Product walkthrough

See it in Cloud Admin

Screens from the live product, with a short note on when you would open each view.

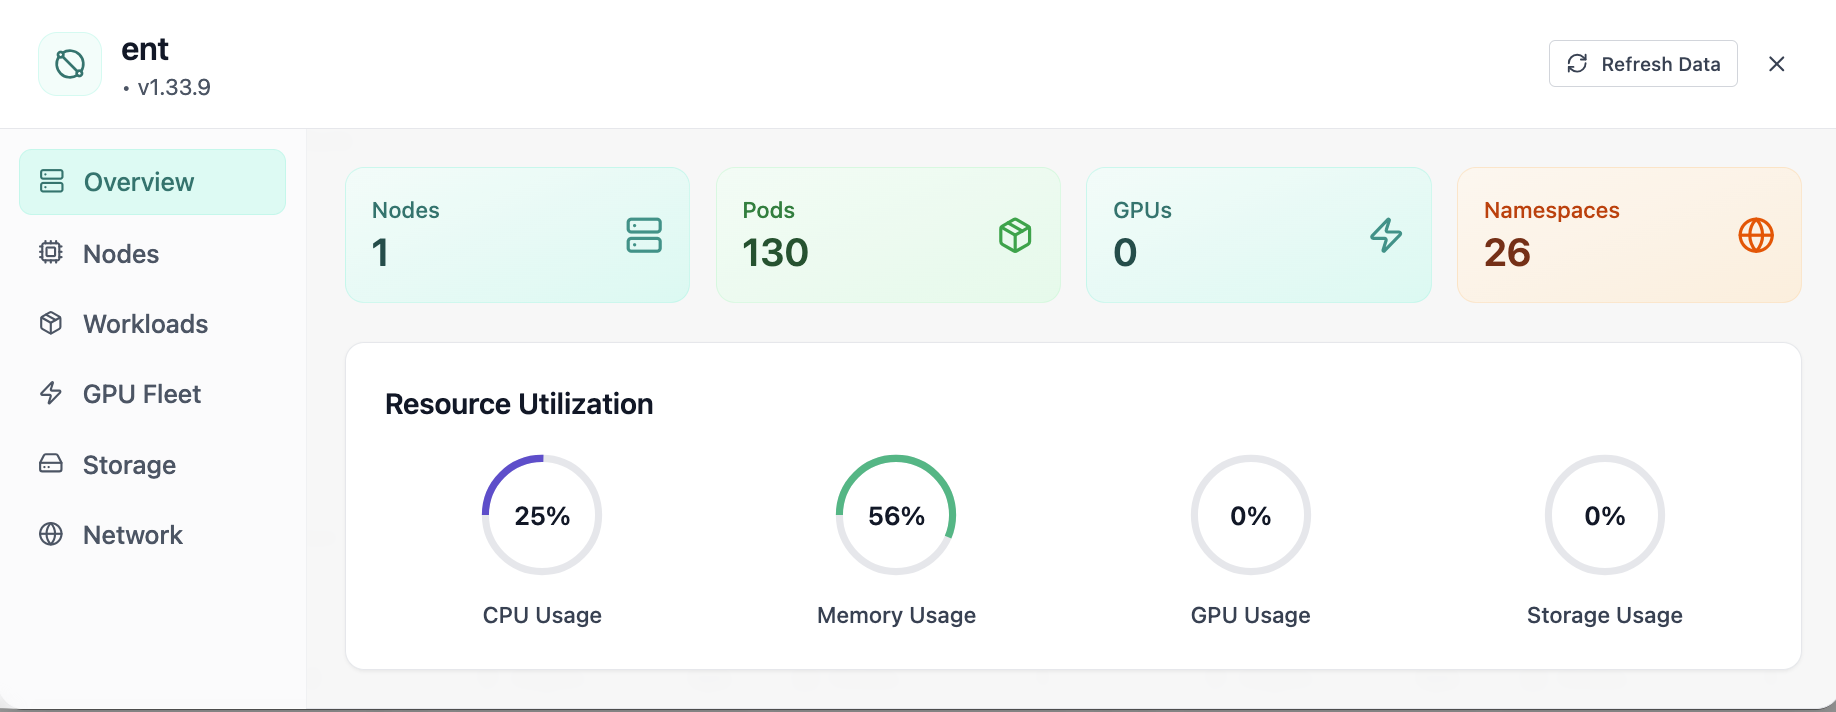
Your starting point for Kubernetes cluster operations: KPI cards and charts summarize fleet health, including cluster overview with nodes, pods, gpus, and utilization gauges. Spot drift early, then drill into the tab that explains the root cause.
01of 07Cloud Admin

Cluster Overview

Your starting point for Kubernetes cluster operations: KPI cards and charts summarize fleet health, including cluster overview with nodes, pods, gpus, and utilization gauges. Spot drift early, then drill into the tab that explains the root cause.

  • GPU and cluster metrics on one screen
  • Charts link utilization to time so you spot spikes quickly
  • One click into deeper tabs when something looks off

Click the screenshot to open full size, zoom, and pan.

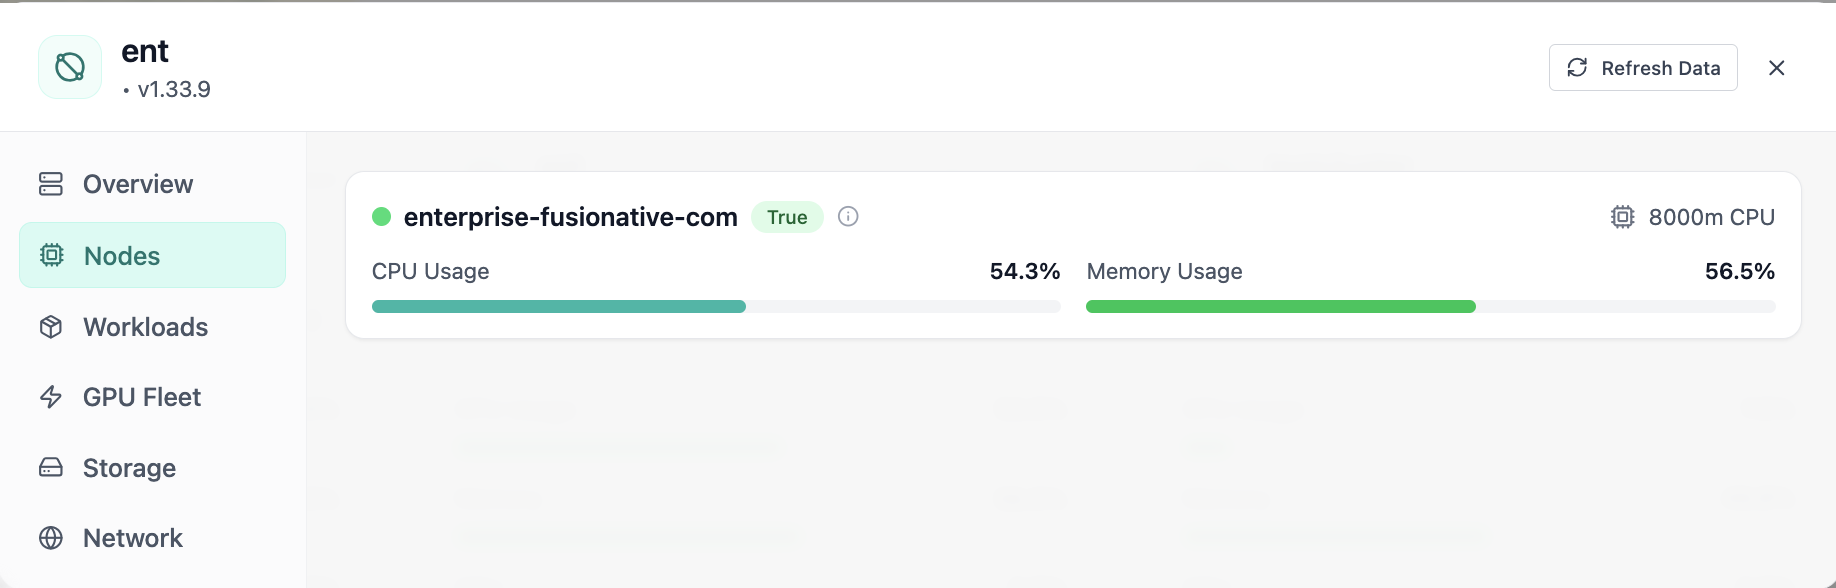
Cluster nodes view with CPU and memory usage per node.
02of 07Cloud Admin

Nodes

Cluster nodes view with CPU and memory usage per node.

  • Same layout your operators see in production
  • Click to zoom in
  • Works alongside the rest of Cloud Admin

Click the screenshot to open full size, zoom, and pan.
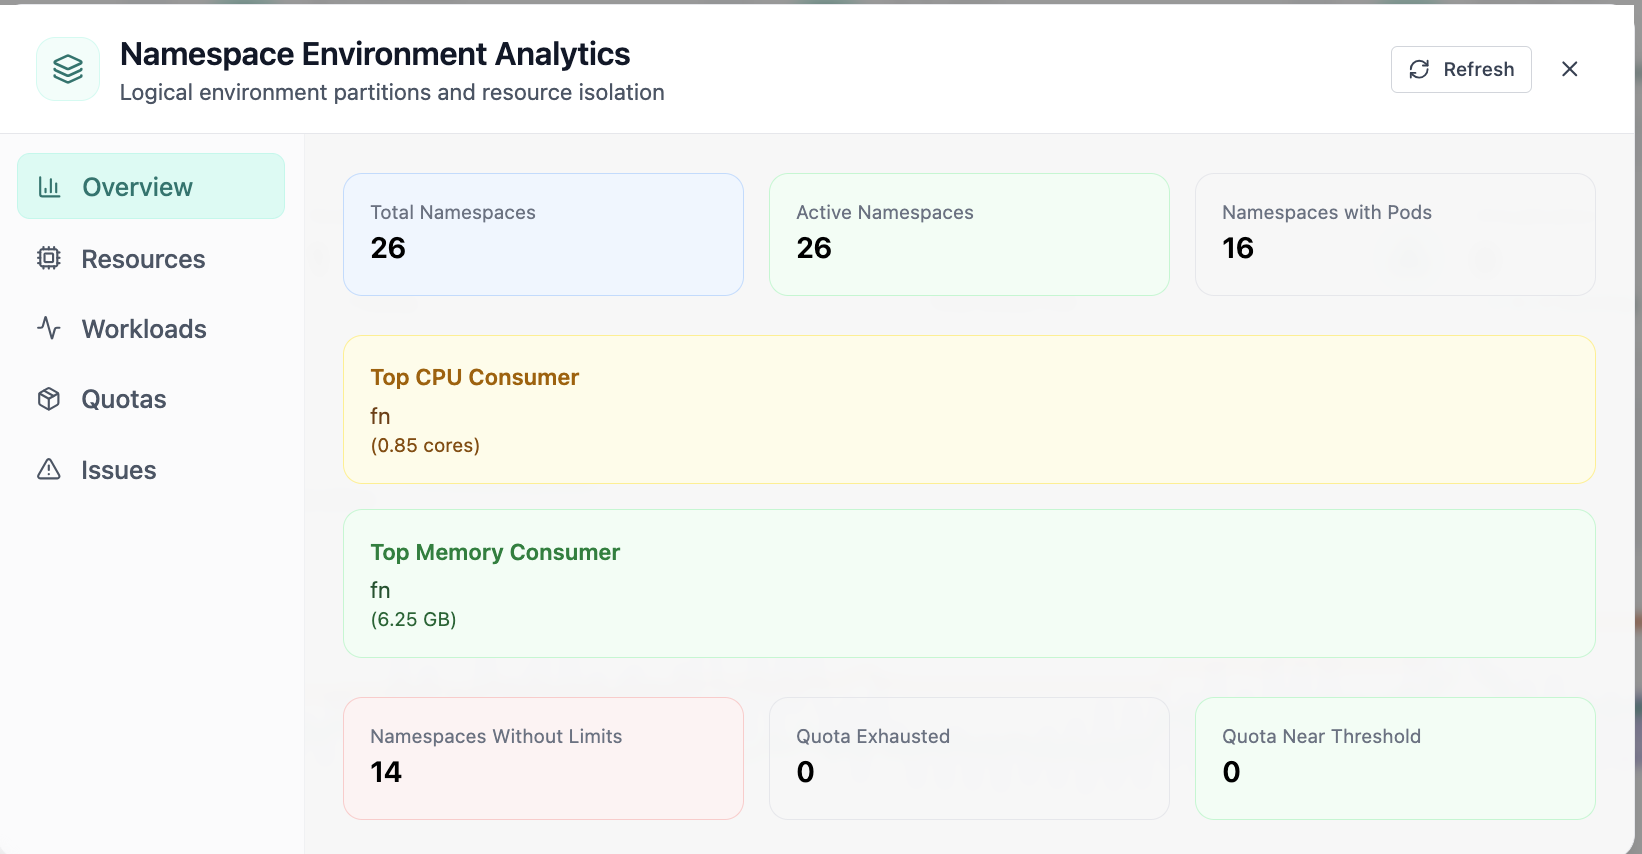
In Namespace Analytics, the Overview view answers one operational question at a time, namespace environment analytics overview and top consumers. Part of Kubernetes cluster operations; use it when you need evidence before changing limits, scaling, or opening a ticket.
03of 07Cloud Admin

Namespace Analytics · Overview

In Namespace Analytics, the Overview view answers one operational question at a time, namespace environment analytics overview and top consumers. Part of Kubernetes cluster operations; use it when you need evidence before changing limits, scaling, or opening a ticket.

  • KPI strip shows the numbers leadership cares about first
  • Charts link utilization to time so you spot spikes quickly
  • One click into deeper tabs when something looks off

Click the screenshot to open full size, zoom, and pan.

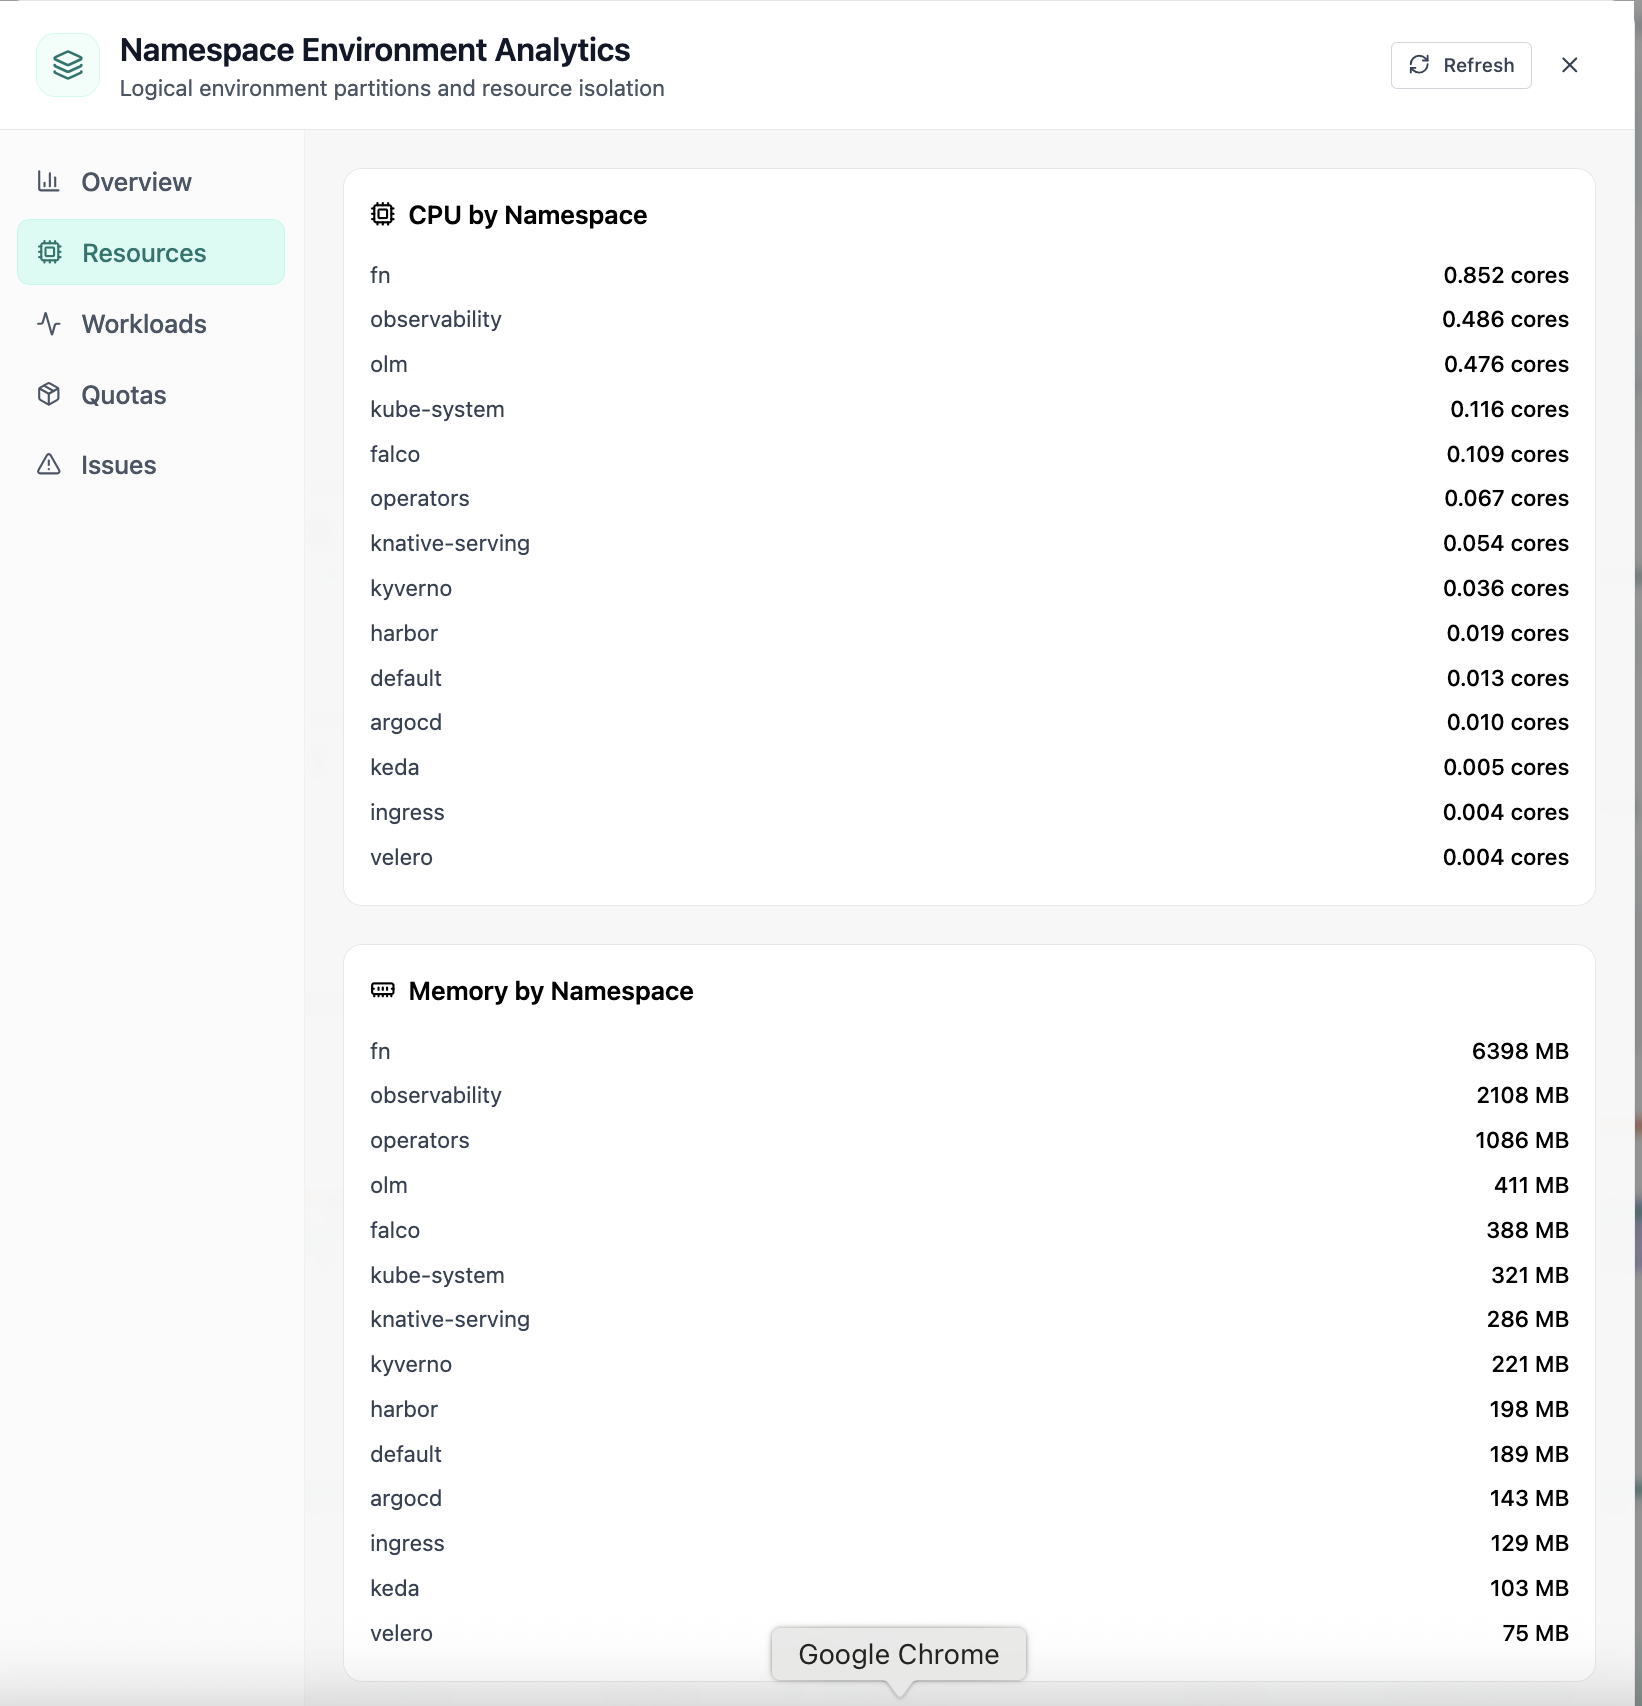
In Namespace, the Resources view answers one operational question at a time, cpu and memory usage by namespace. Part of Kubernetes cluster operations; use it when you need evidence before changing limits, scaling, or opening a ticket.
04of 07Cloud Admin

Namespace · Resources

In Namespace, the Resources view answers one operational question at a time, cpu and memory usage by namespace. Part of Kubernetes cluster operations; use it when you need evidence before changing limits, scaling, or opening a ticket.

  • Same layout your operators see in production
  • Click to zoom in
  • Works alongside the rest of Cloud Admin

Click the screenshot to open full size, zoom, and pan.
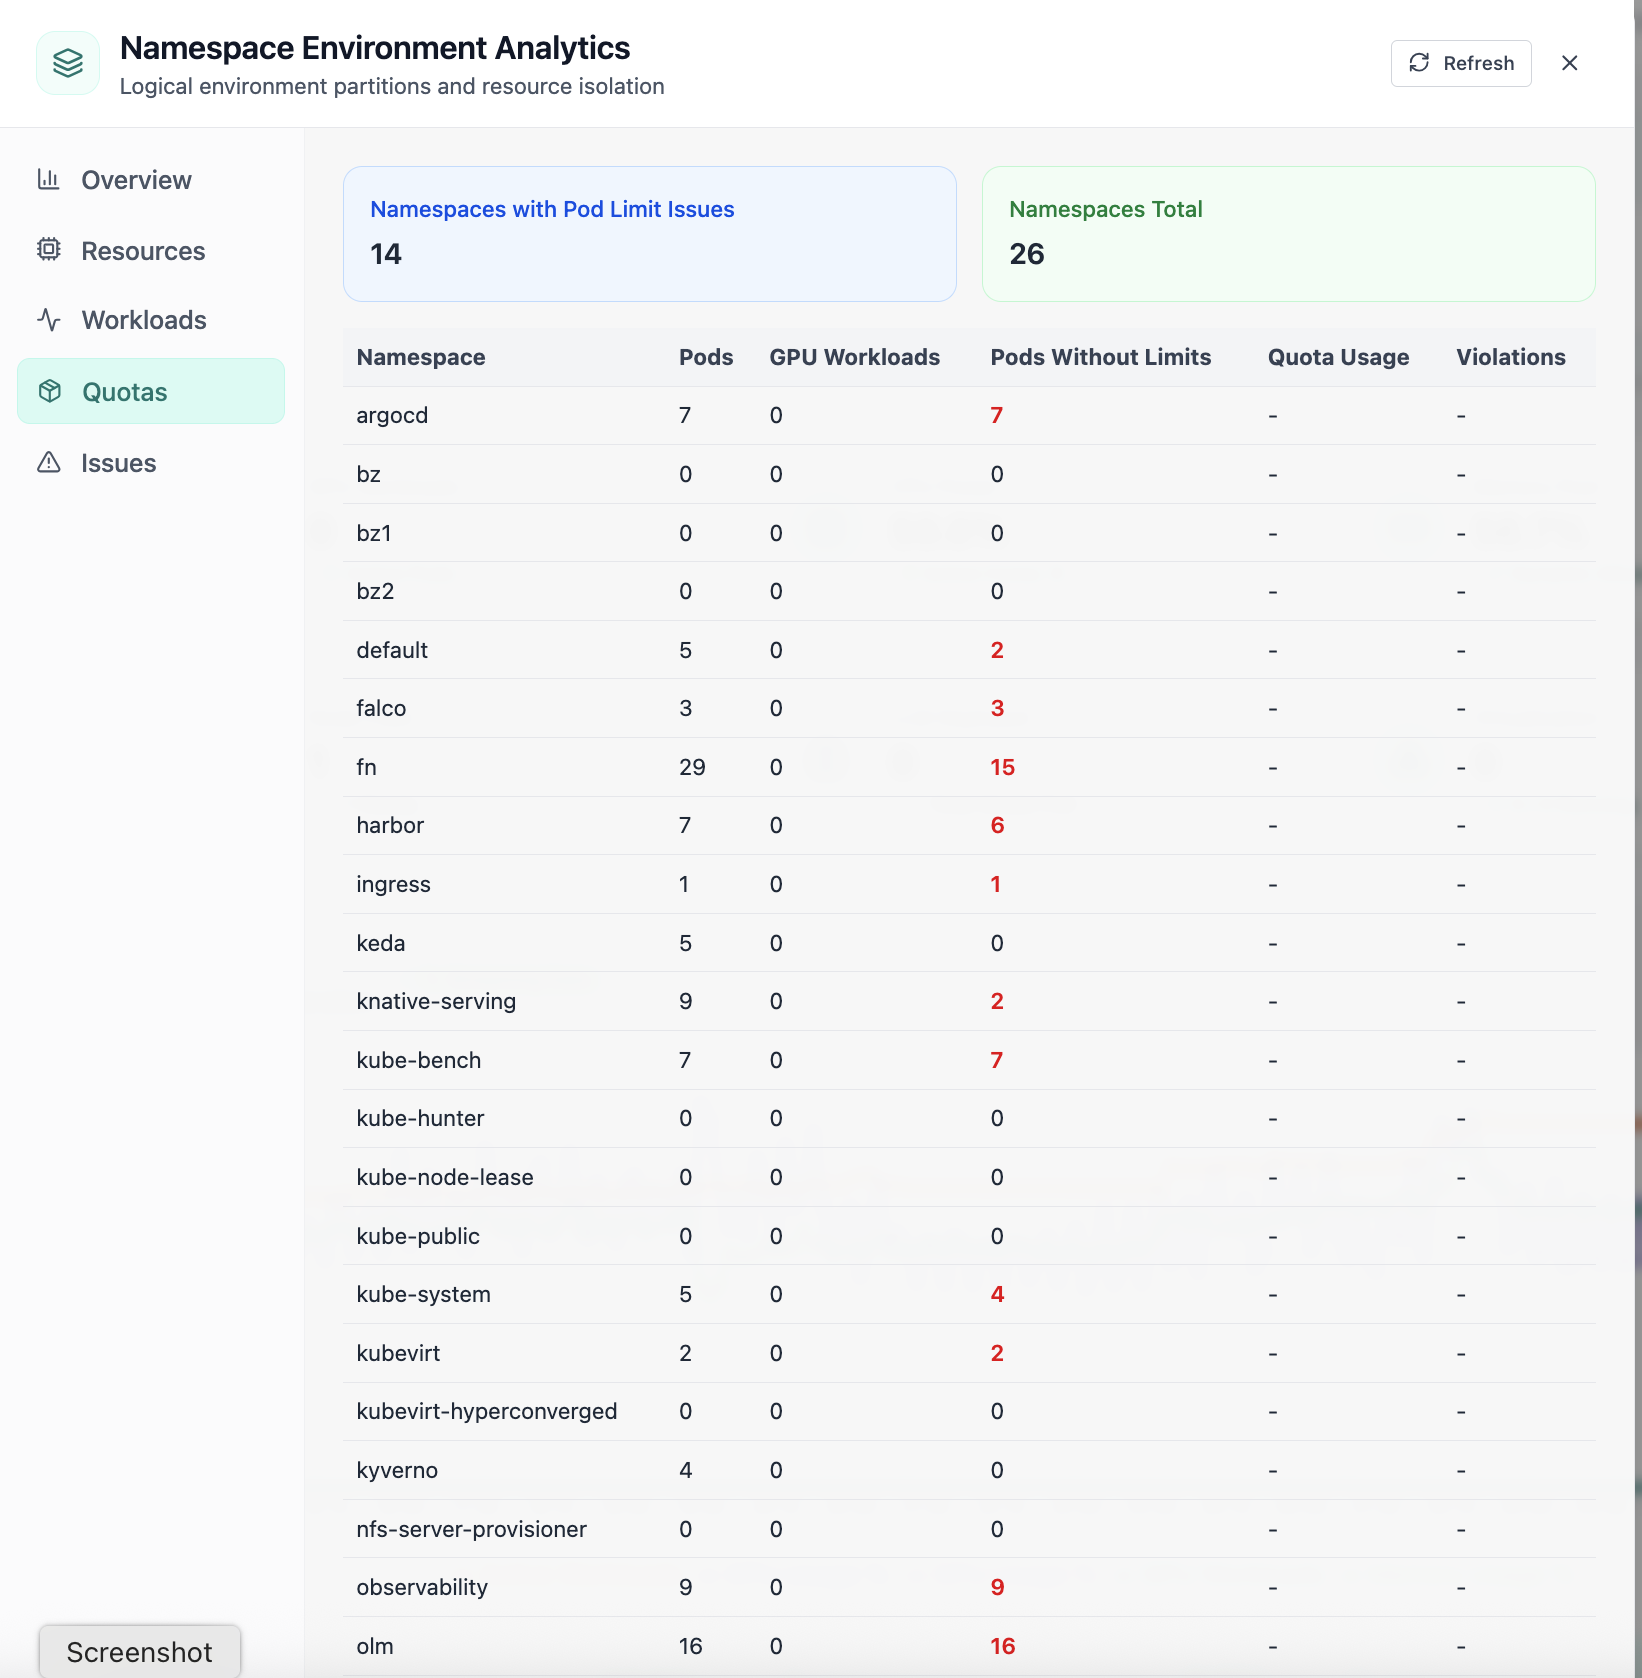
In Namespace, the Quotas view answers one operational question at a time, namespace quota limits and pod limit issues. Part of Kubernetes cluster operations; use it when you need evidence before changing limits, scaling, or opening a ticket.
05of 07Cloud Admin

Namespace · Quotas

In Namespace, the Quotas view answers one operational question at a time, namespace quota limits and pod limit issues. Part of Kubernetes cluster operations; use it when you need evidence before changing limits, scaling, or opening a ticket.

  • Per-organization limits visible to admins and tenants
  • Usage meters explain who is consuming shared capacity
  • Supports chargeback and fair-share policy conversations

Click the screenshot to open full size, zoom, and pan.

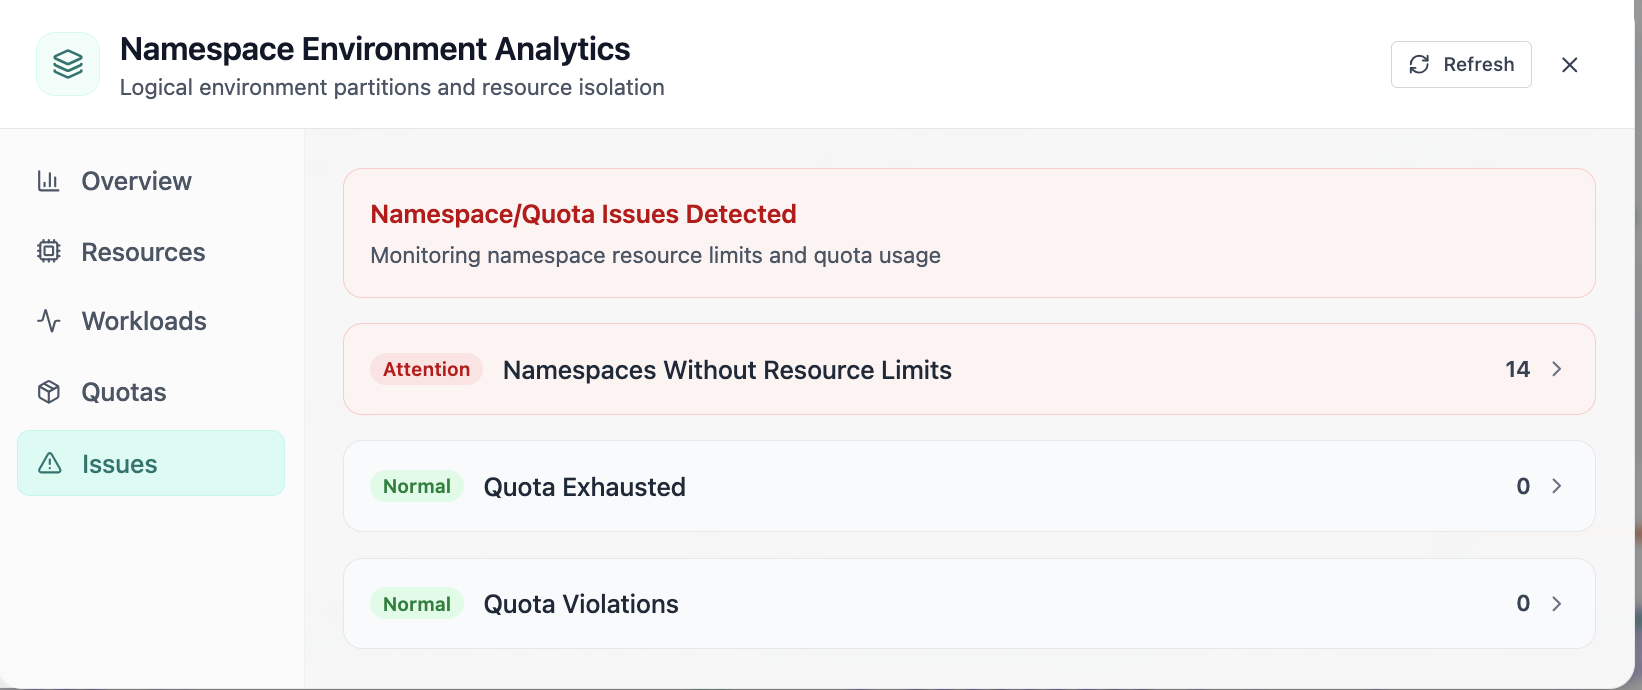
In Namespace, the Issues view answers one operational question at a time, namespaces without limits and quota violations. Part of Kubernetes cluster operations; use it when you need evidence before changing limits, scaling, or opening a ticket.
06of 07Cloud Admin

Namespace · Issues

In Namespace, the Issues view answers one operational question at a time, namespaces without limits and quota violations. Part of Kubernetes cluster operations; use it when you need evidence before changing limits, scaling, or opening a ticket.

  • Problems ranked so the noisiest failures surface first
  • Enough context to assign an owner without opening five tools
  • Clear next step: scale, restart, patch quota, or escalate

Click the screenshot to open full size, zoom, and pan.

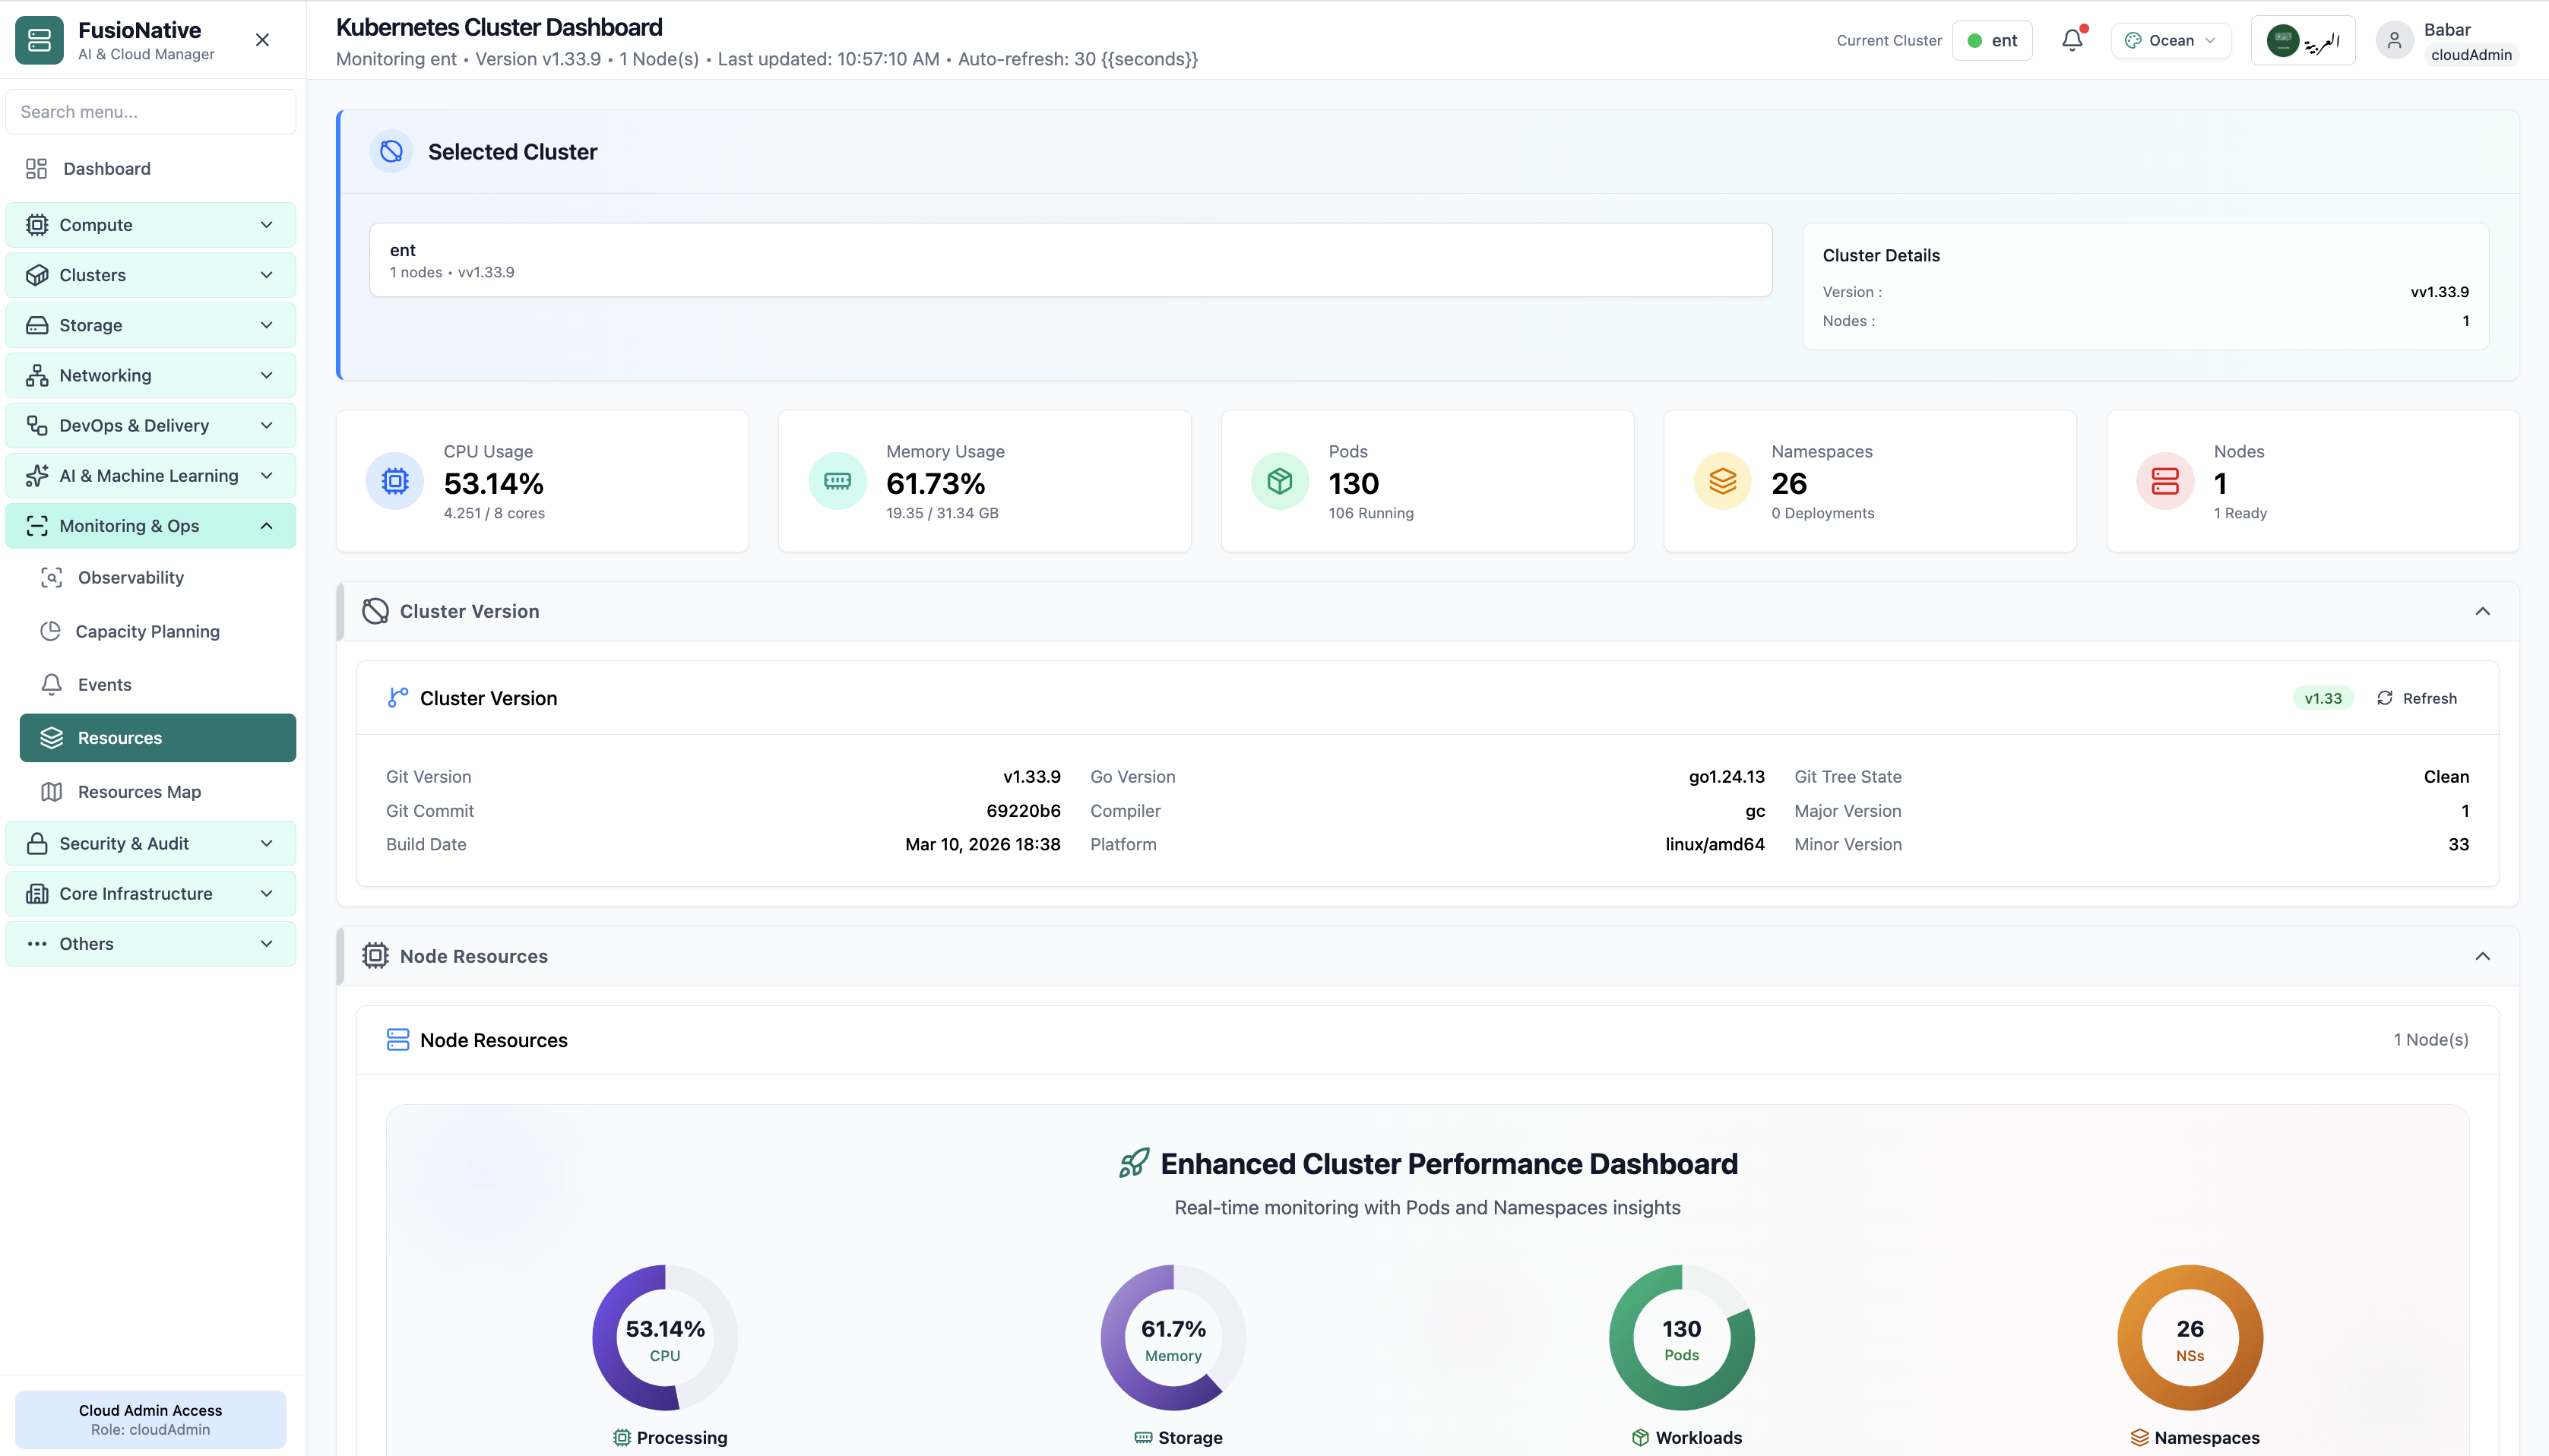
Your starting point for Kubernetes cluster operations: KPI cards and charts summarize fleet health, including kubernetes cluster dashboard with cpu, memory, pod, and node gauges. Spot drift early, then drill into the tab that explains the root cause.
07of 07Cloud Admin

Kubernetes Cluster Dashboard

Your starting point for Kubernetes cluster operations: KPI cards and charts summarize fleet health, including kubernetes cluster dashboard with cpu, memory, pod, and node gauges. Spot drift early, then drill into the tab that explains the root cause.

  • KPI strip shows the numbers leadership cares about first
  • Charts link utilization to time so you spot spikes quickly
  • One click into deeper tabs when something looks off

Click the screenshot to open full size, zoom, and pan.

From headline to node

One screen for “is the cluster healthy?” and “which node is lying?”

Cluster Resources bridges executive KPIs and SRE forensics: the same refresh cycle feeds the top strip, capacity vs usage bars, and node cards, so debates reference one dataset.

Warning thresholds baked in

Capacity charts call out when allocated share crosses policy bands, less guesswork than raw gauge colors alone.

Console when kubectl is faster

Node cards expose console access for operators who need immediate shell validation beside the charts.

Fleet-ready metadata

Version and build metadata help compare clusters during upgrades without opening vendor PDFs.

Monitoring & Ops

Resources Map

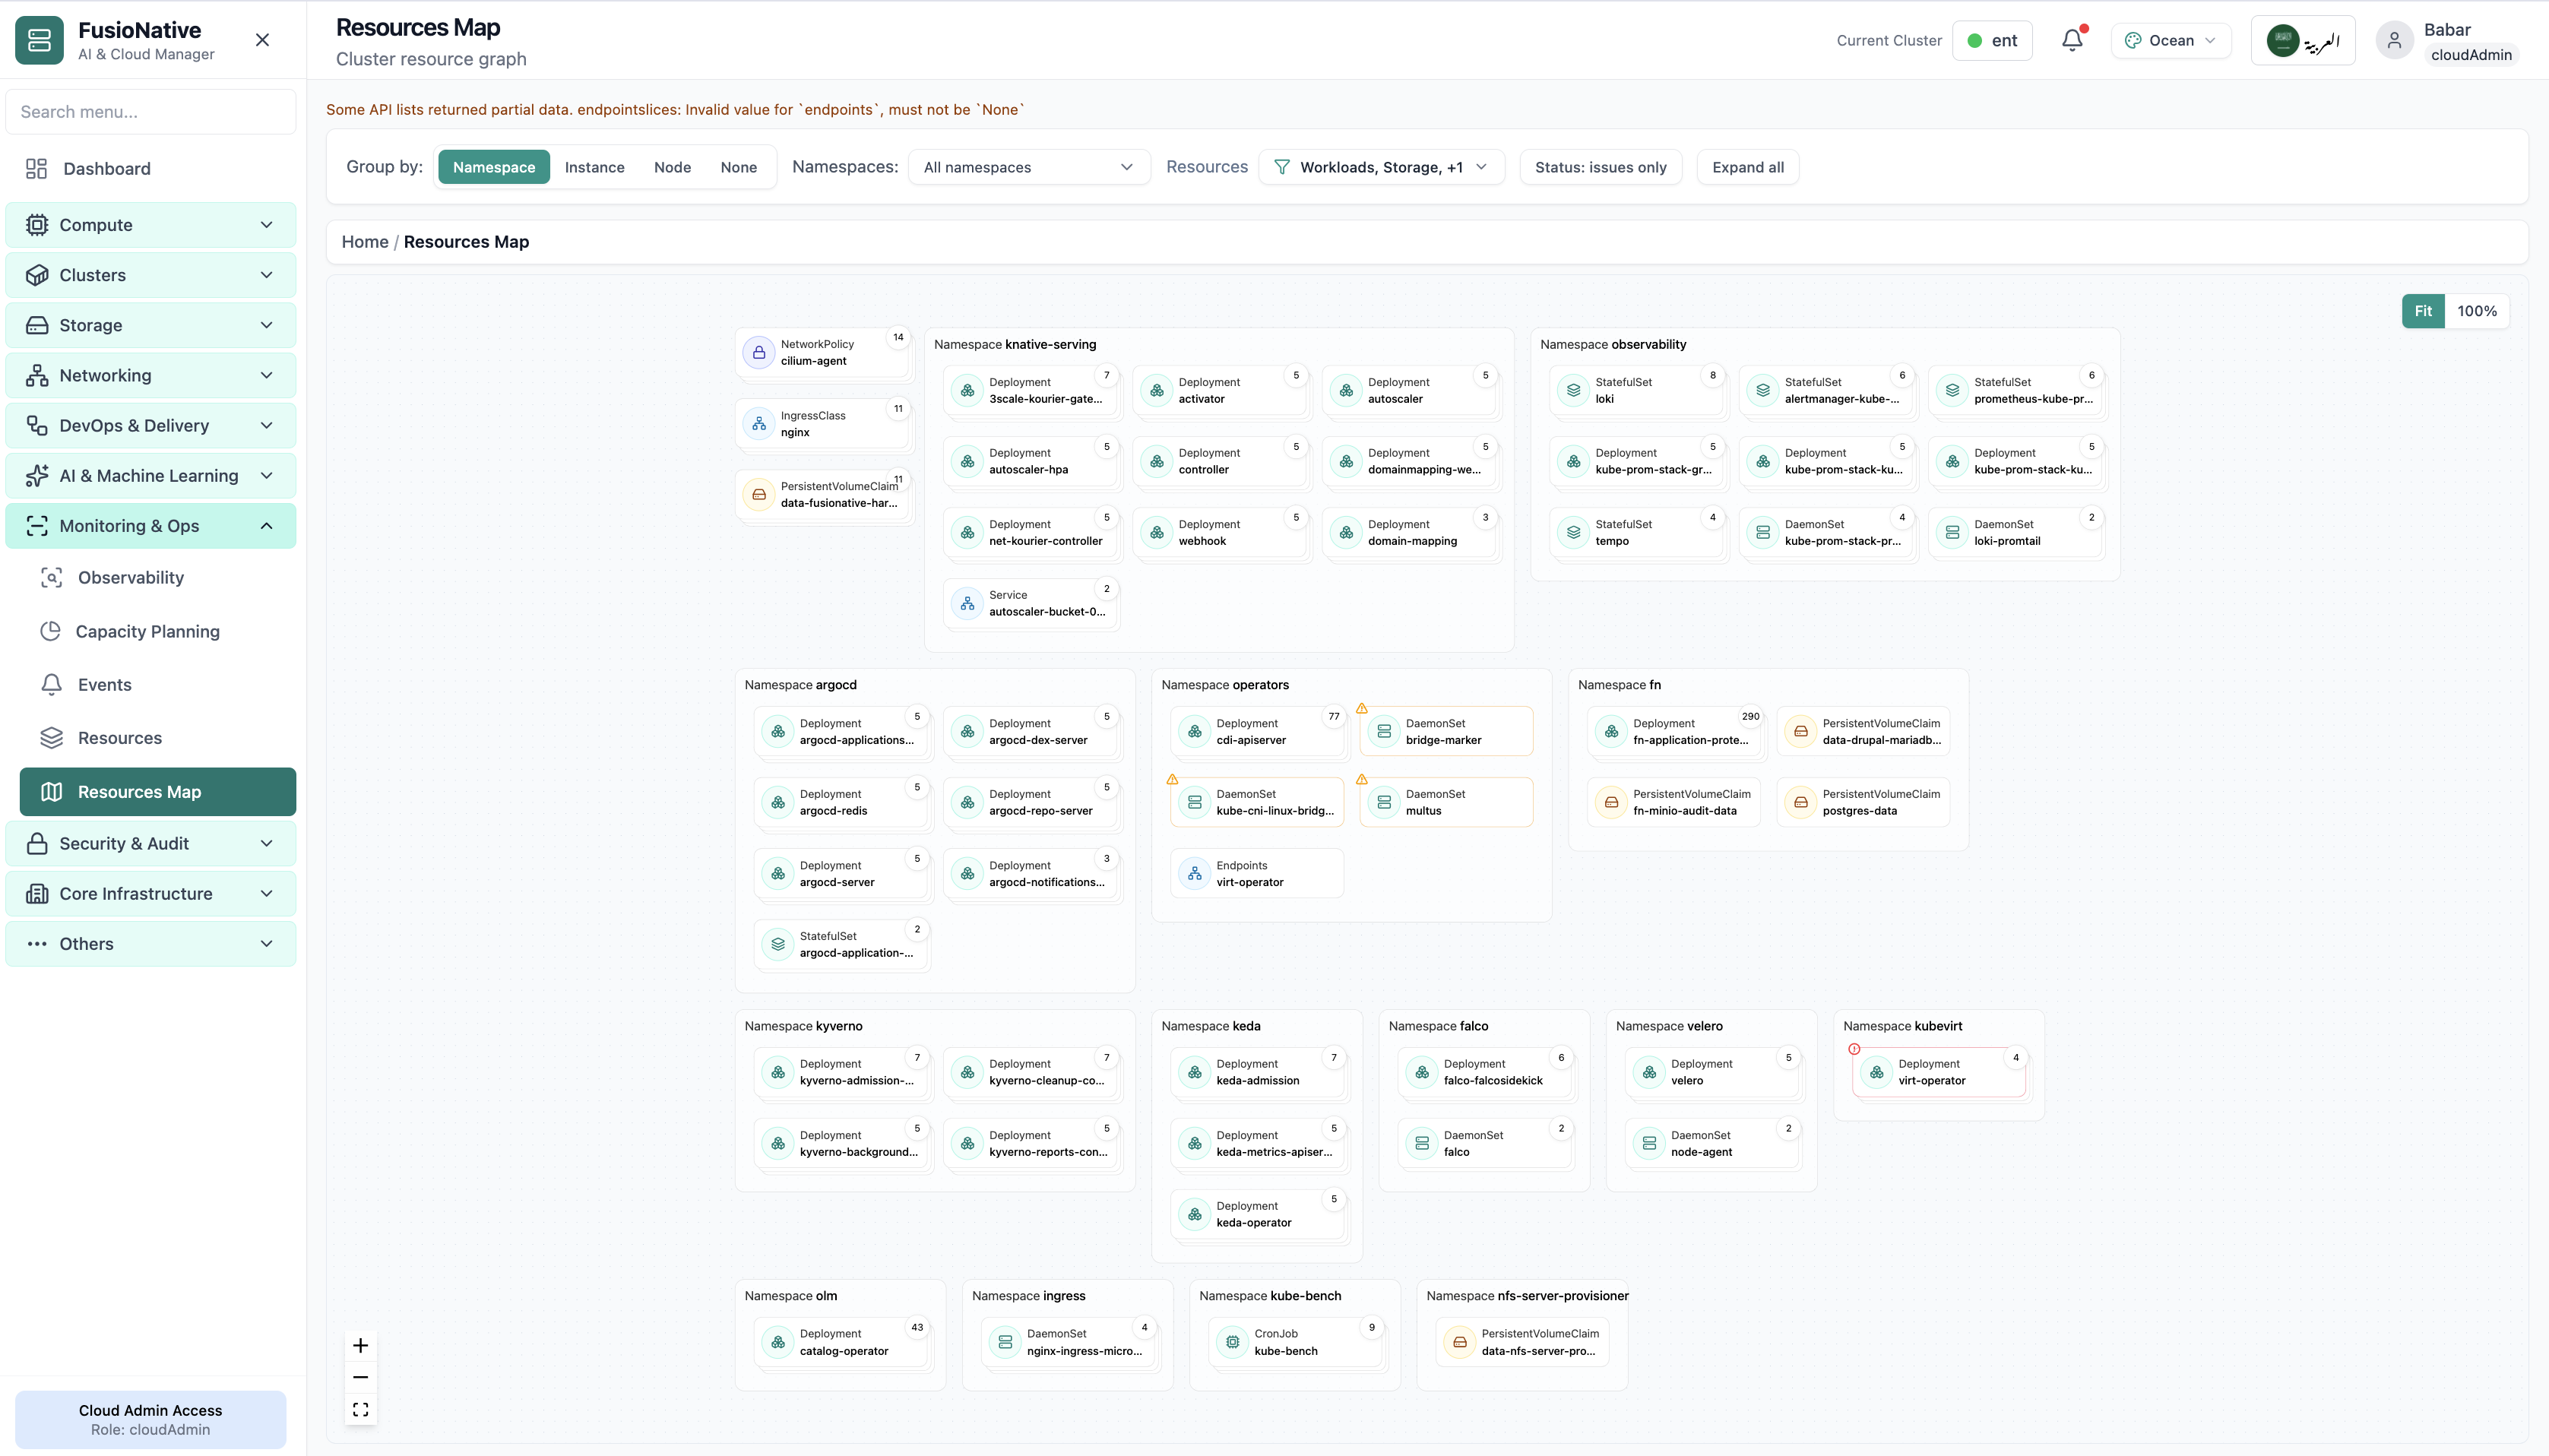
Open Monitoring & Ops → Resources Map for a spatial view of the cluster: namespaces as swimlanes, workload and storage cards inside each lane, and controls to group by namespace, instance, node, or none, plus namespace and resource-type filters, an Issues only toggle, expand/collapse, and zoom to fit.

Product walkthrough

See it in Cloud Admin

Screens from the live product, with a short note on when you would open each view.

Cluster resource topology graph by namespace.
01of 01Cloud Admin

Resources Map

Cluster resource topology graph by namespace.

  • Same layout your operators see in production
  • Click to zoom in
  • Works alongside the rest of Cloud Admin

Click the screenshot to open full size, zoom, and pan.
Living diagram

Make the API graph legible at fleet scale

Resources Map is for the moment when everyone asks “what shares that namespace?”, grouping, filters, and issue-only mode answer it without exporting a dozen kubectl transcripts.

Honest partial data

When list APIs return slices or validation warnings, the UI can surface them, so “empty” never means “healthy” by accident.

Issues-only triage

Flip to degraded cards only during incidents; expand all when you need the full context for a change window.

Same cluster, same story

The map respects the cluster picker used across Monitoring & Ops, no duplicate “which kubeconfig am I holding?” moments.

Multi-cluster

Manage Clusters

When Kubernetes estates span teams and regions, “green” is not enough. FusioNative ranks environments, surfaces connectivity or metric gaps, and keeps remediation paths obvious.

Product walkthrough

Manage every environment from one place

Screens from the live product, with a short note on when you would open each view.

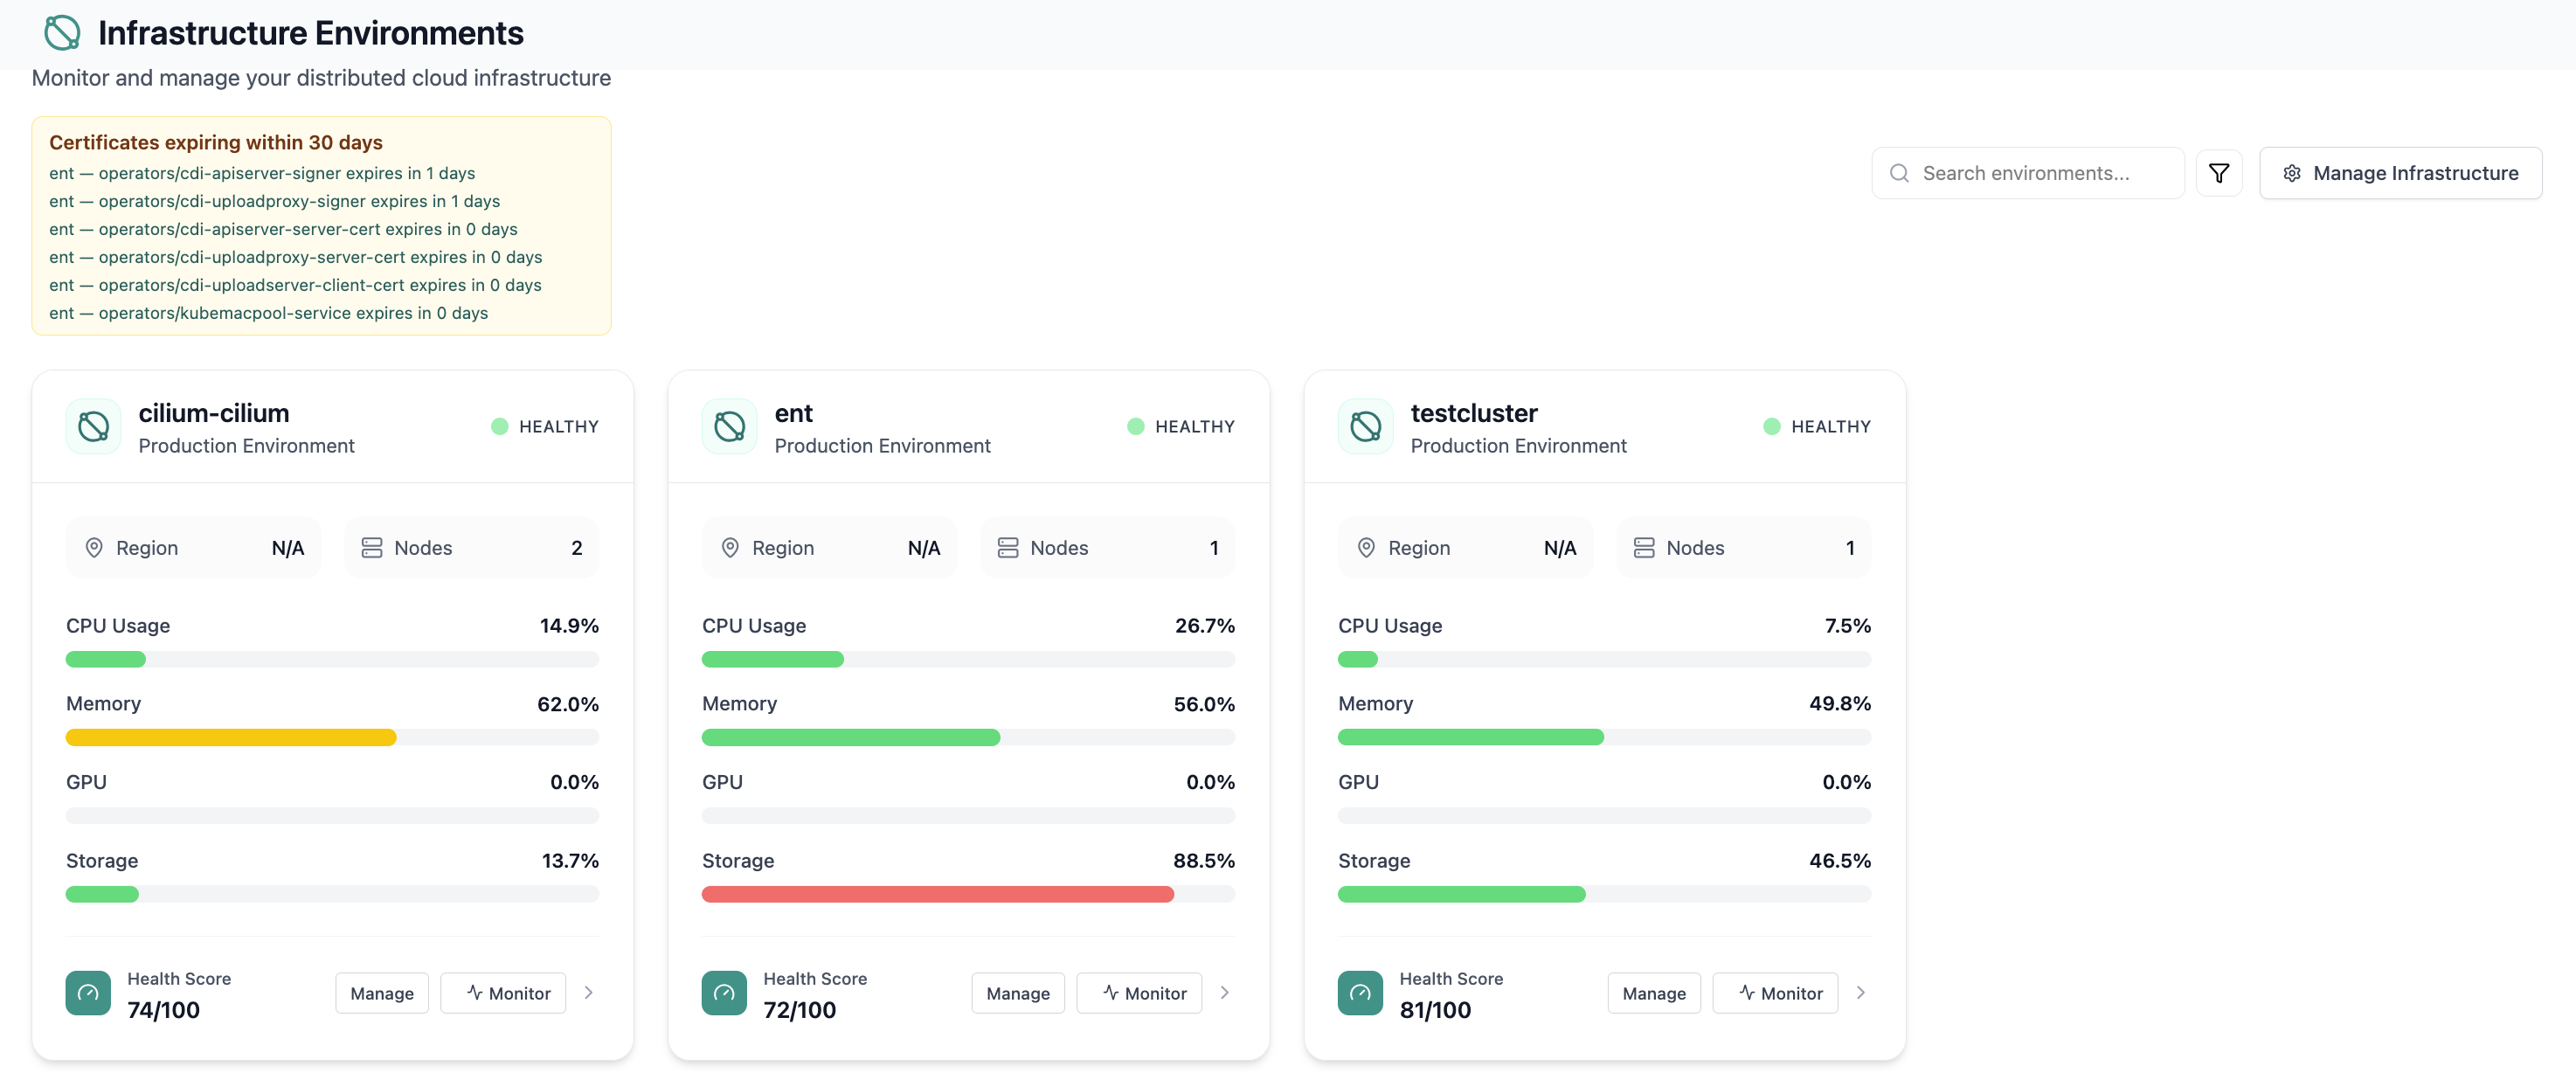
Infrastructure environment cards with health scores and utilization.
01of 03Cloud Admin

Infrastructure Environments

Infrastructure environment cards with health scores and utilization.

  • Same layout your operators see in production
  • Click to zoom in
  • Works alongside the rest of Cloud Admin

Click the screenshot to open full size, zoom, and pan.
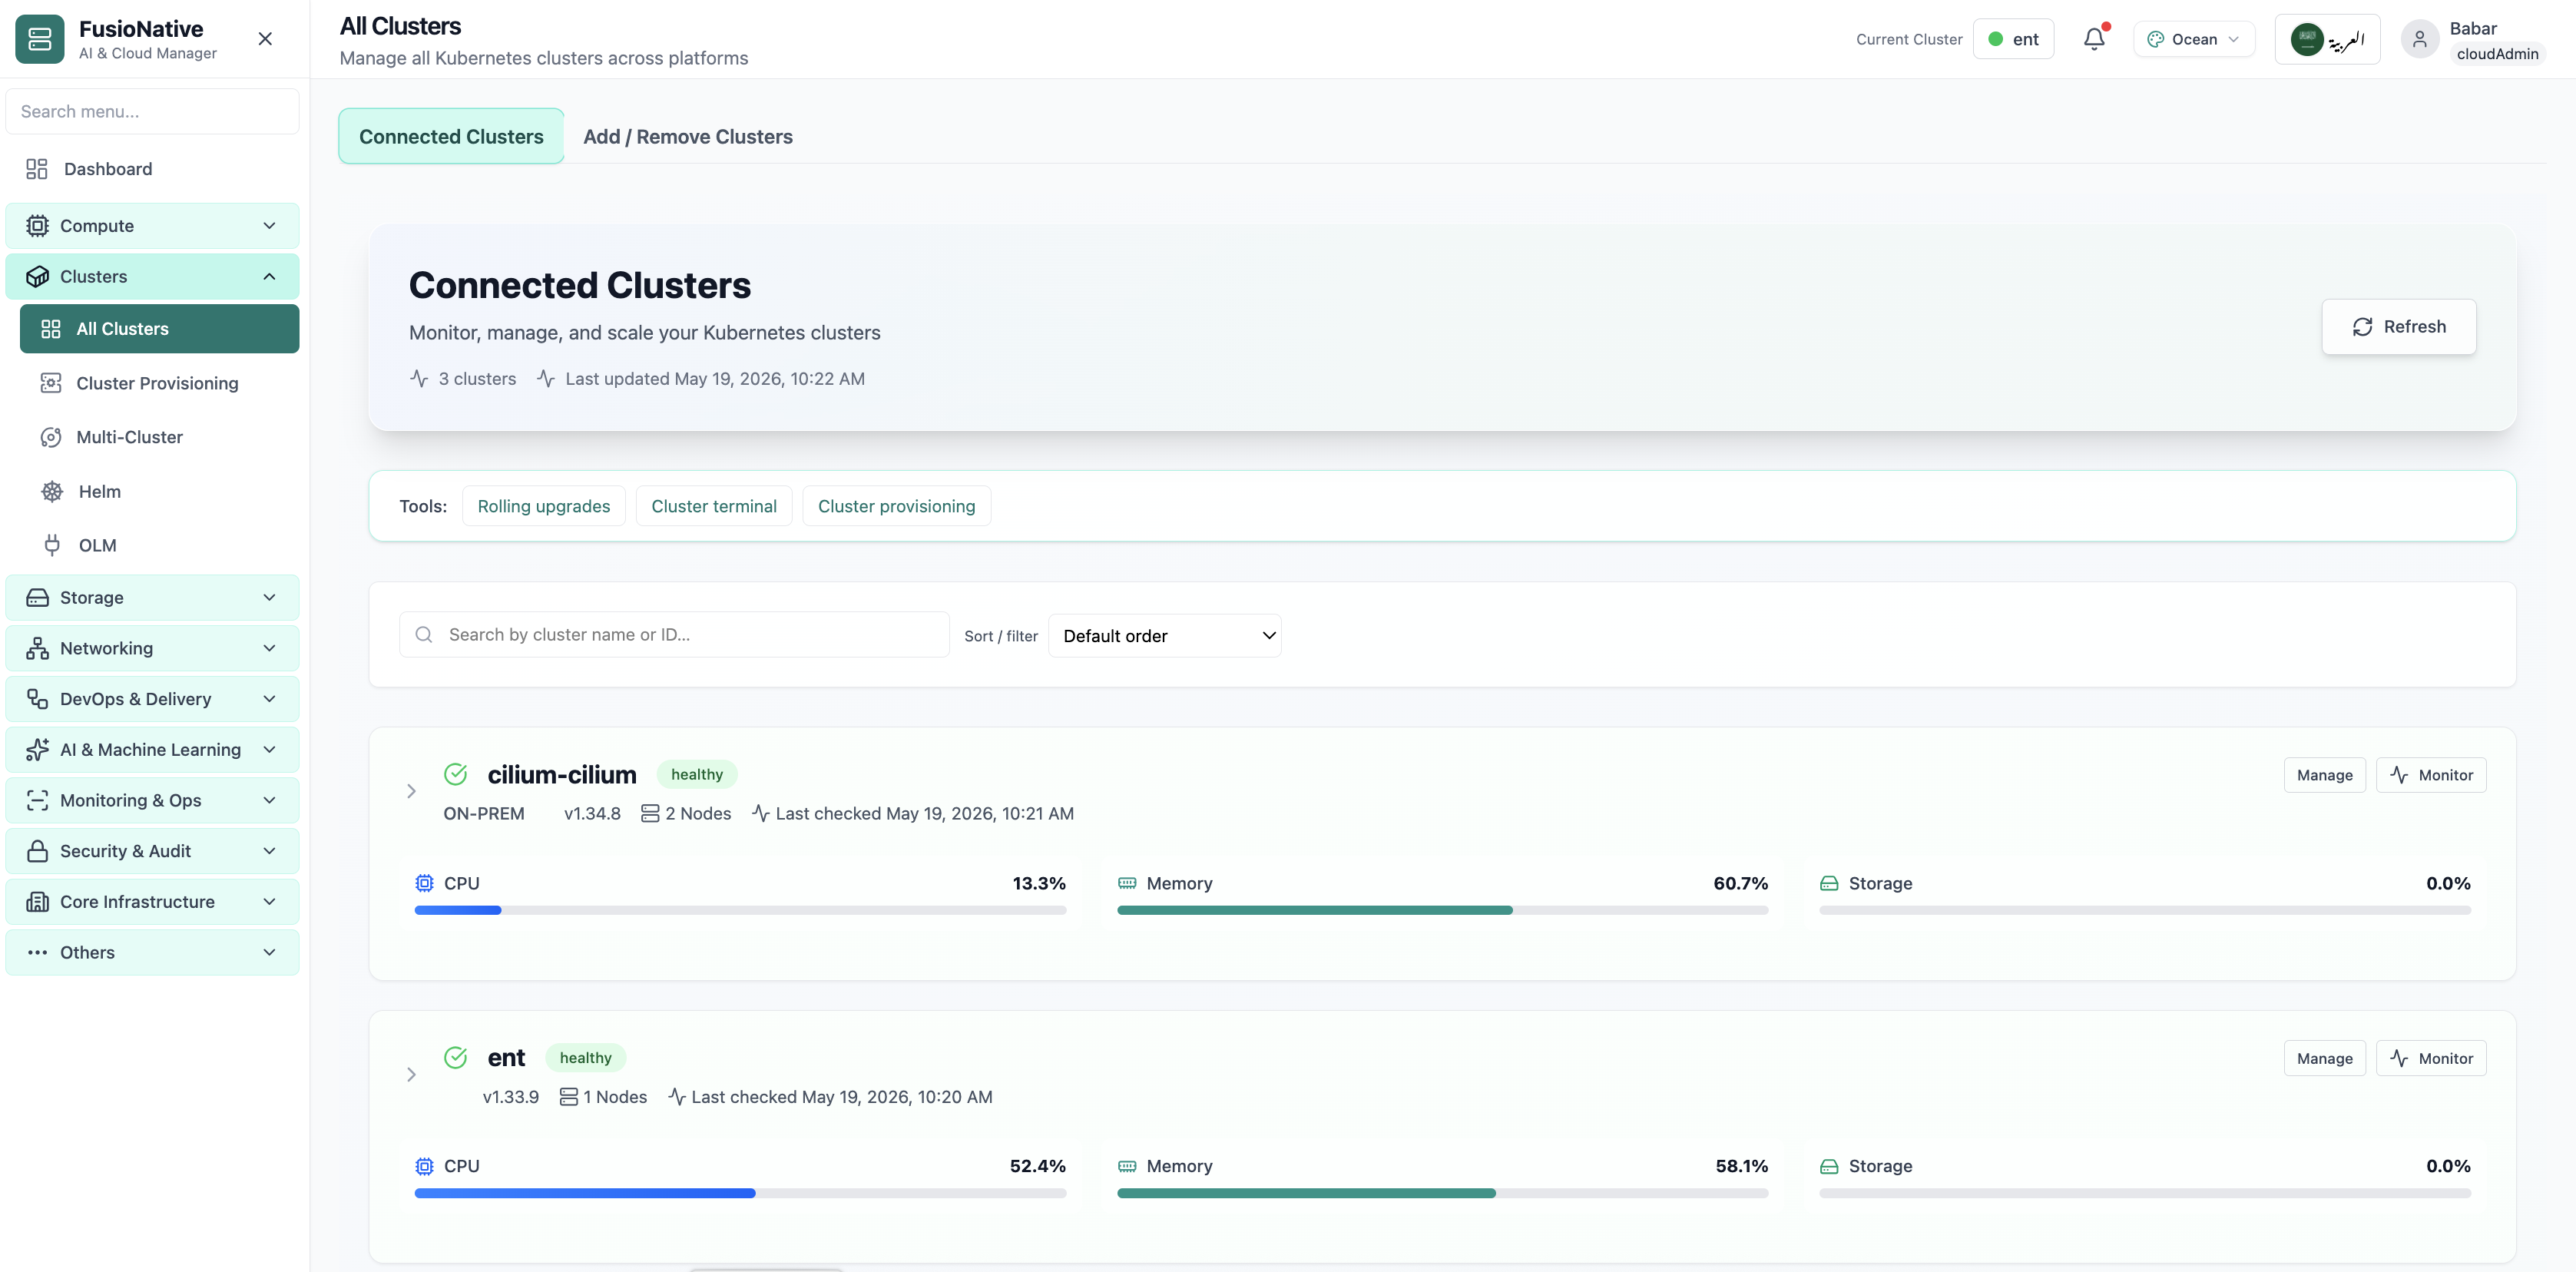
All Clusters list with health, version, and resource bars.
02of 03Cloud Admin

All Clusters

All Clusters list with health, version, and resource bars.

  • Same layout your operators see in production
  • Click to zoom in
  • Works alongside the rest of Cloud Admin

Click the screenshot to open full size, zoom, and pan.
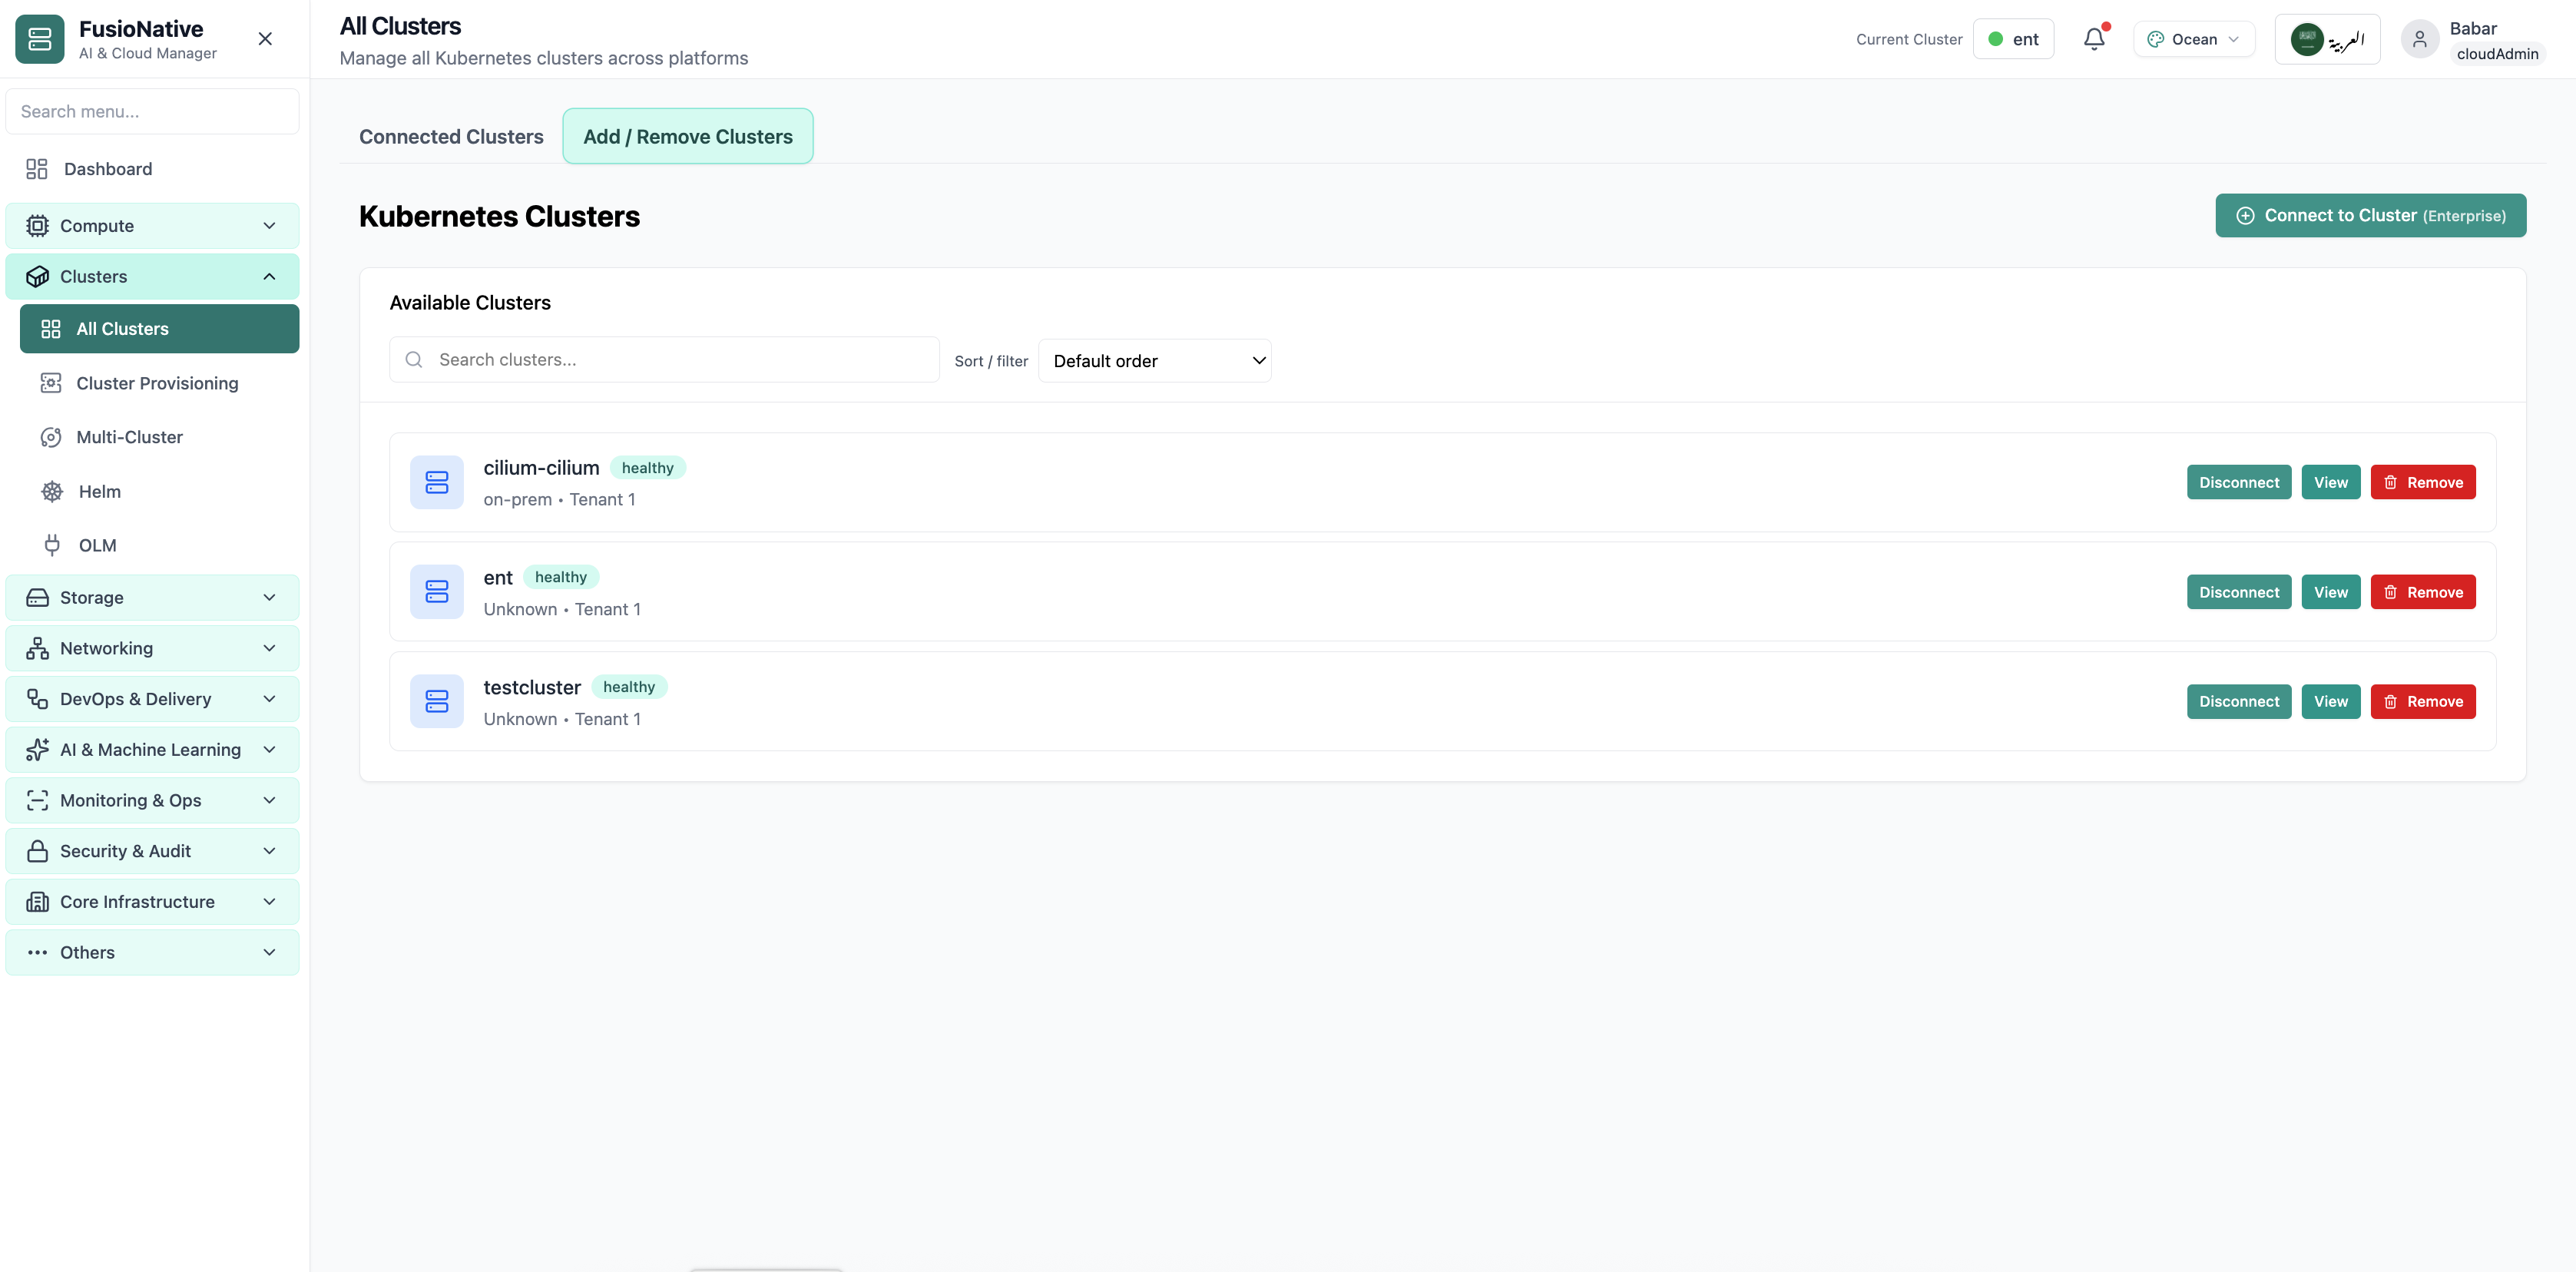
Cluster management table with connection and status details.
03of 03Cloud Admin

Cluster inventory

Cluster management table with connection and status details.

  • Same layout your operators see in production
  • Click to zoom in
  • Works alongside the rest of Cloud Admin

Click the screenshot to open full size, zoom, and pan.
Security & Audit

Secure Operations · Security Center

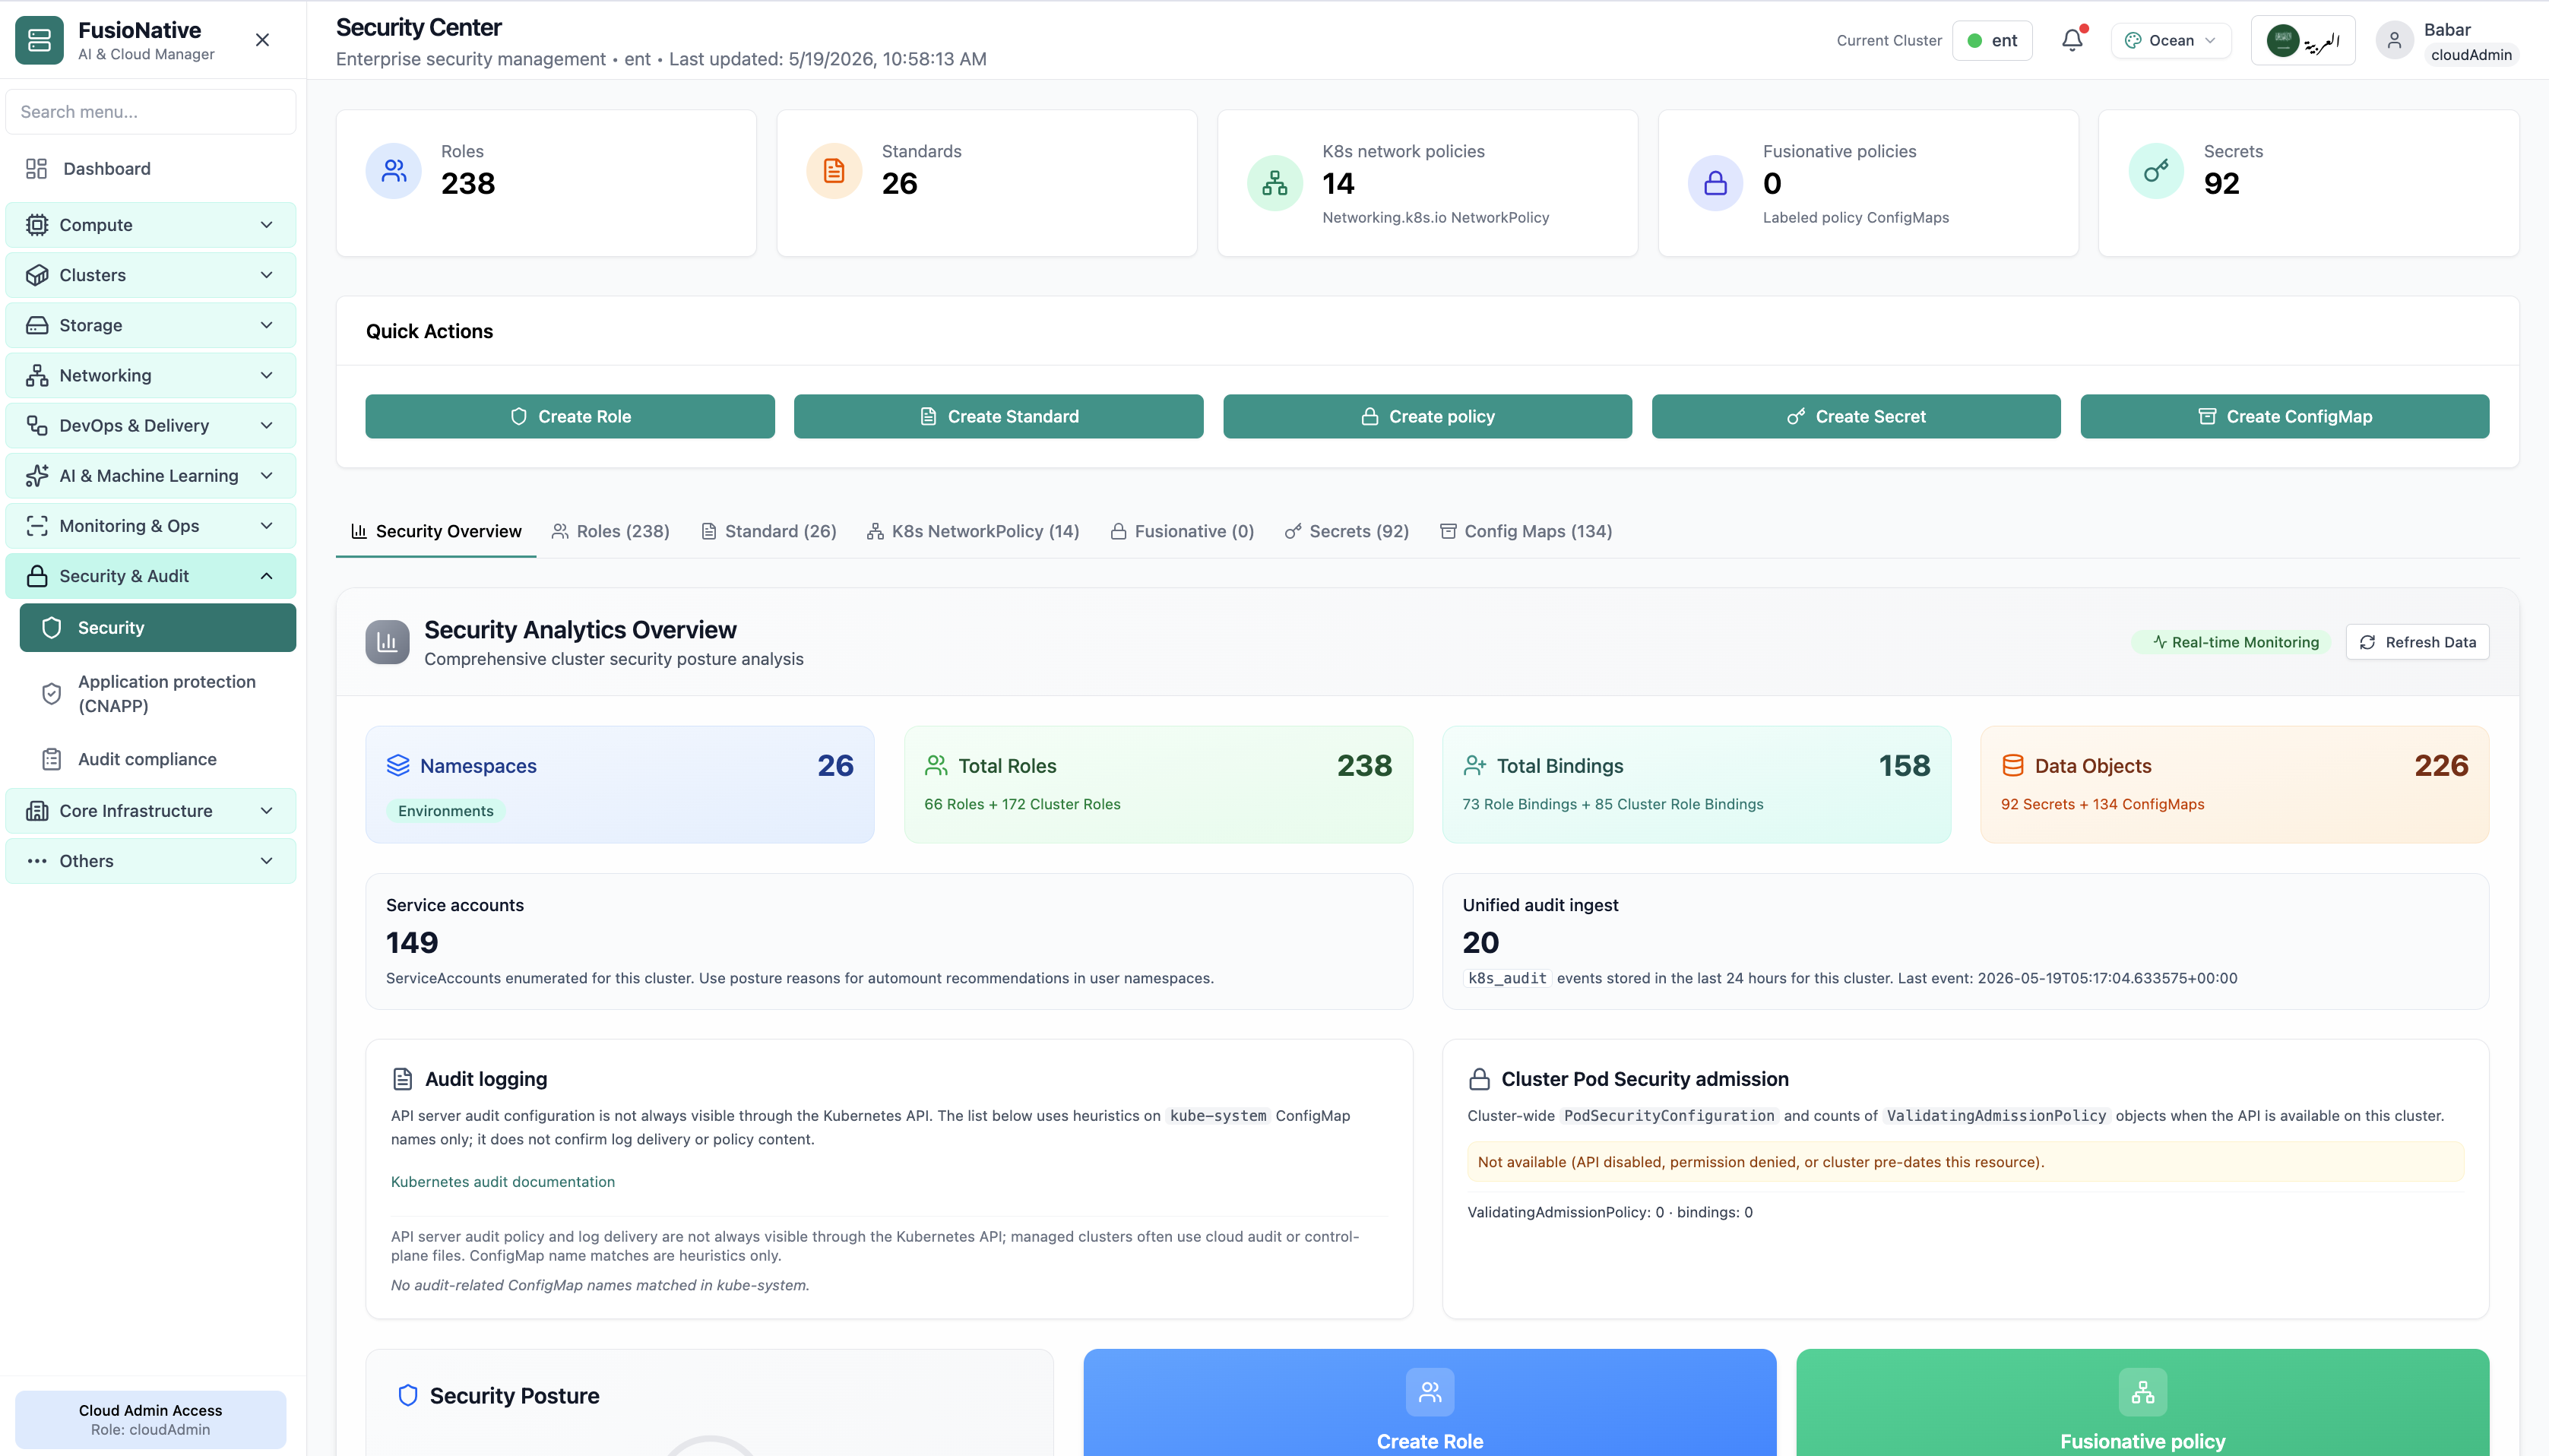
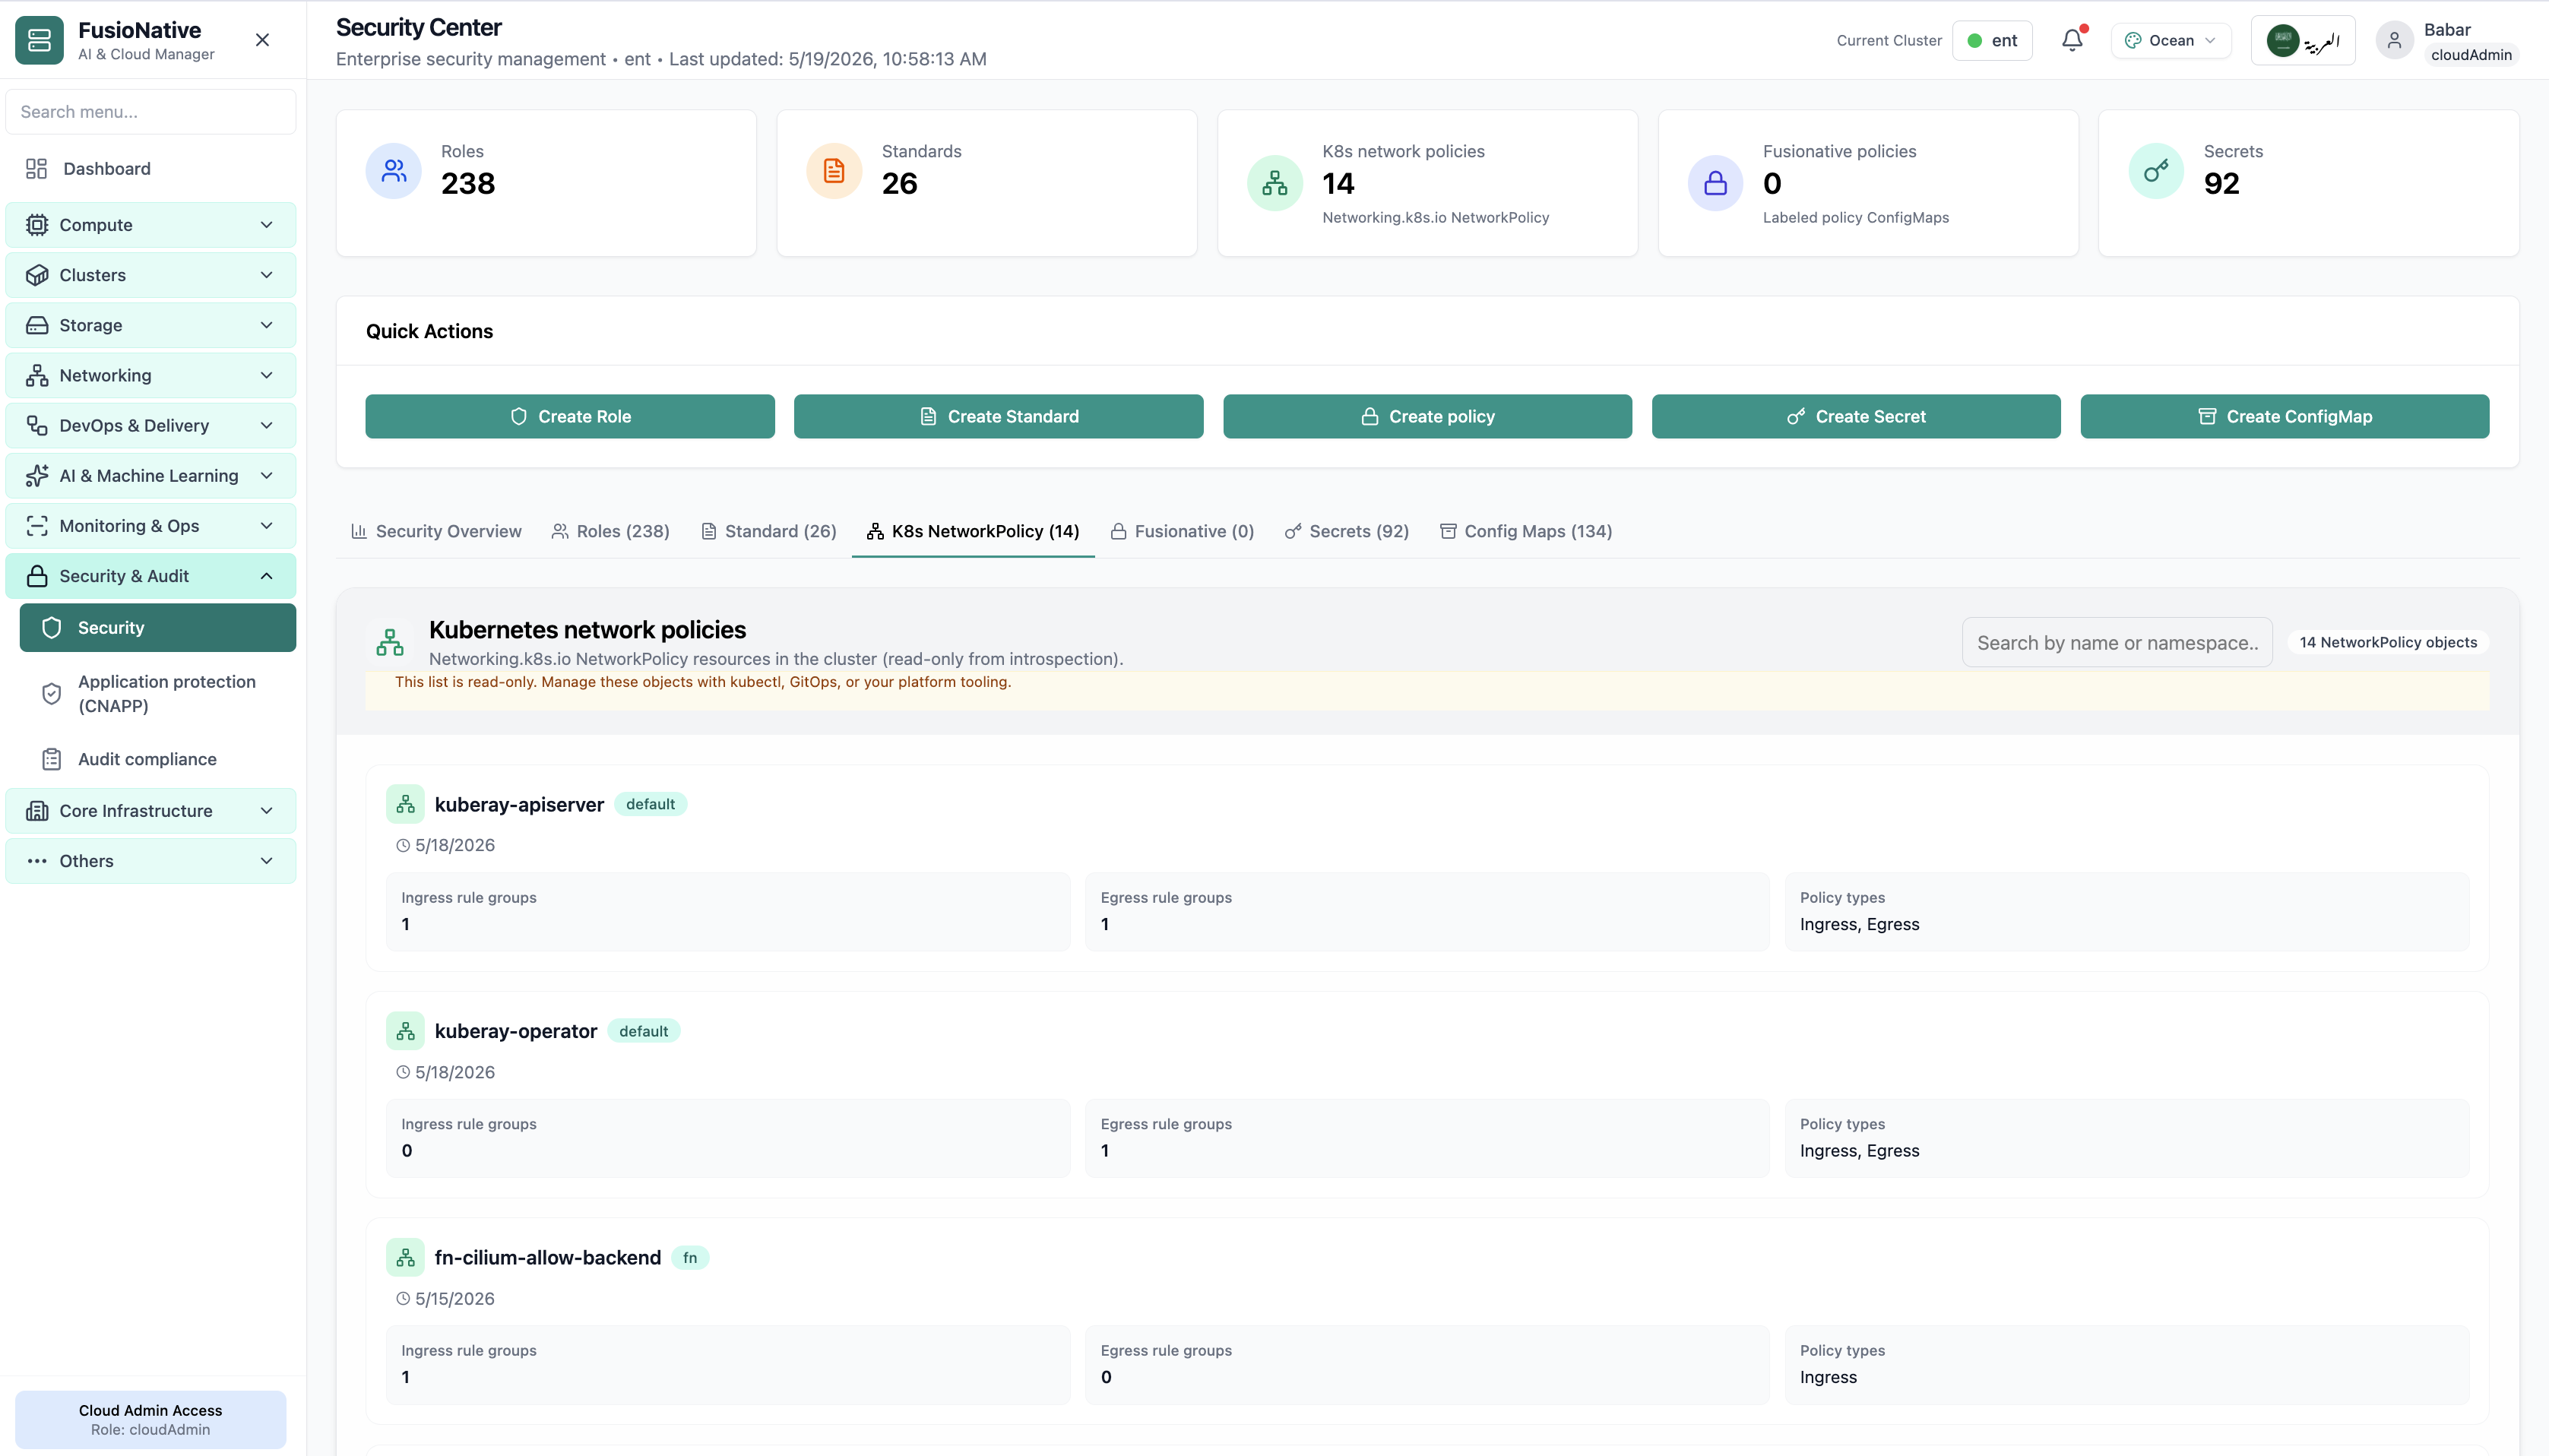
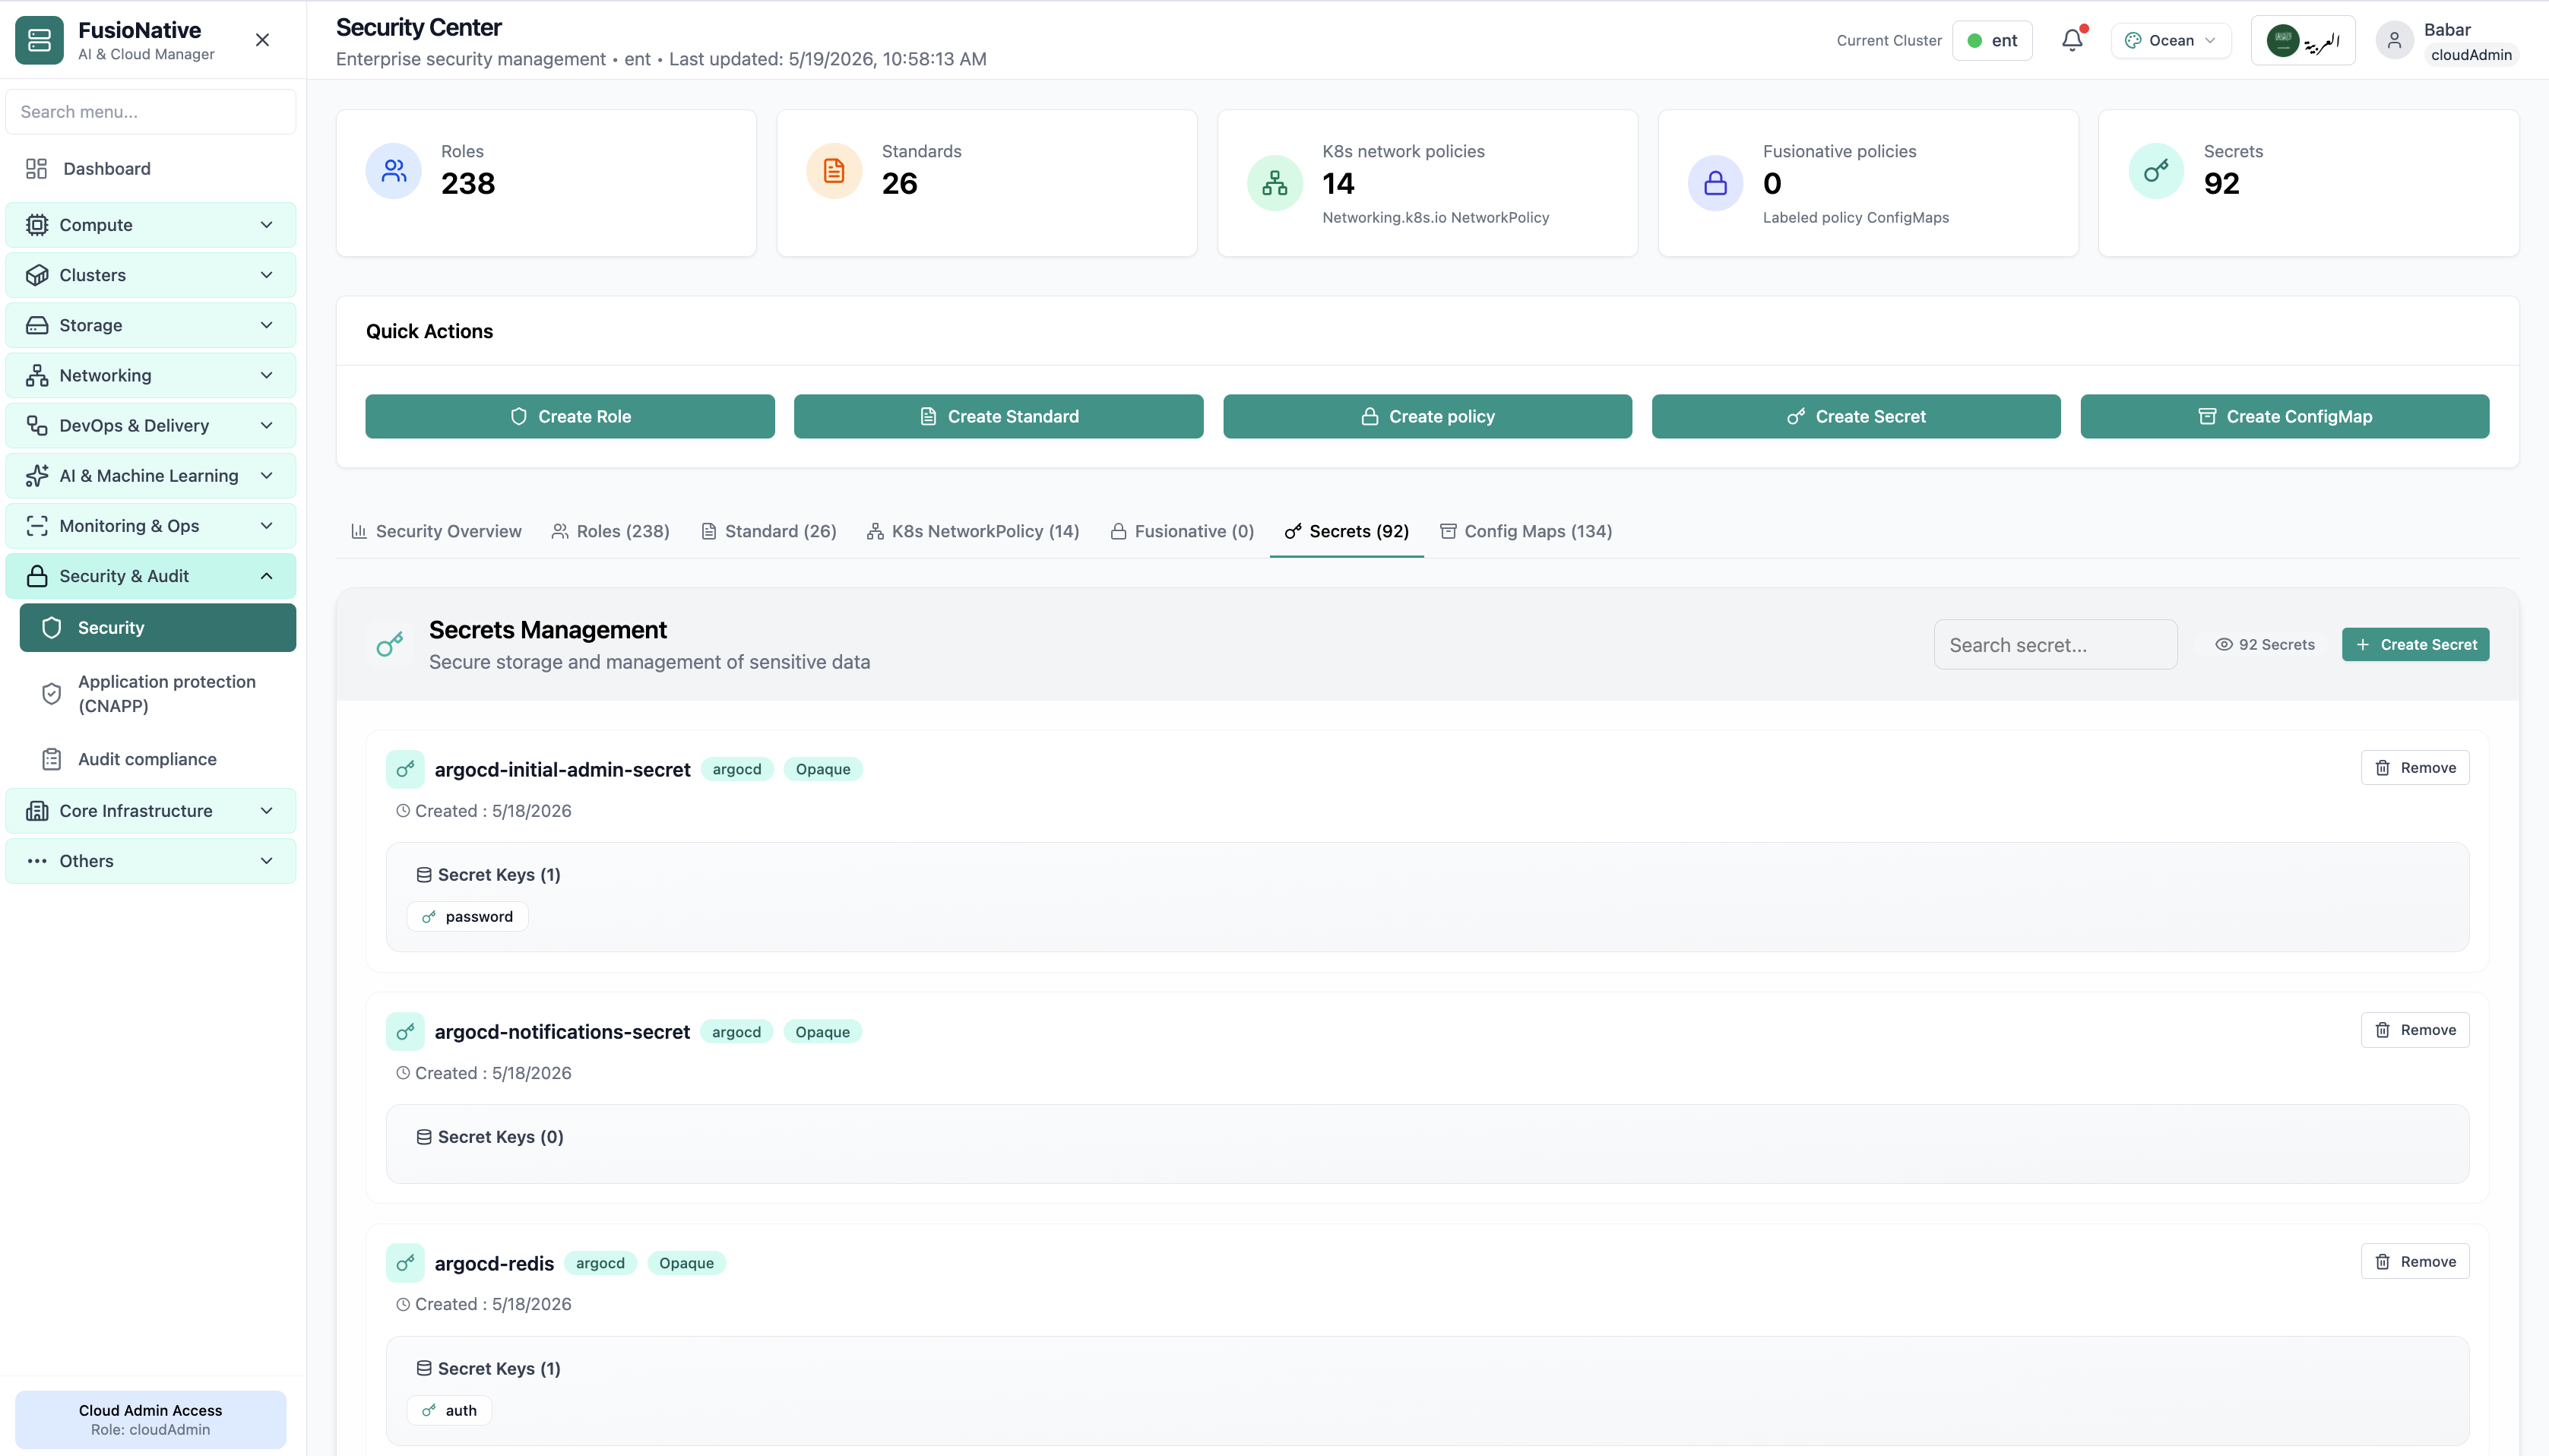
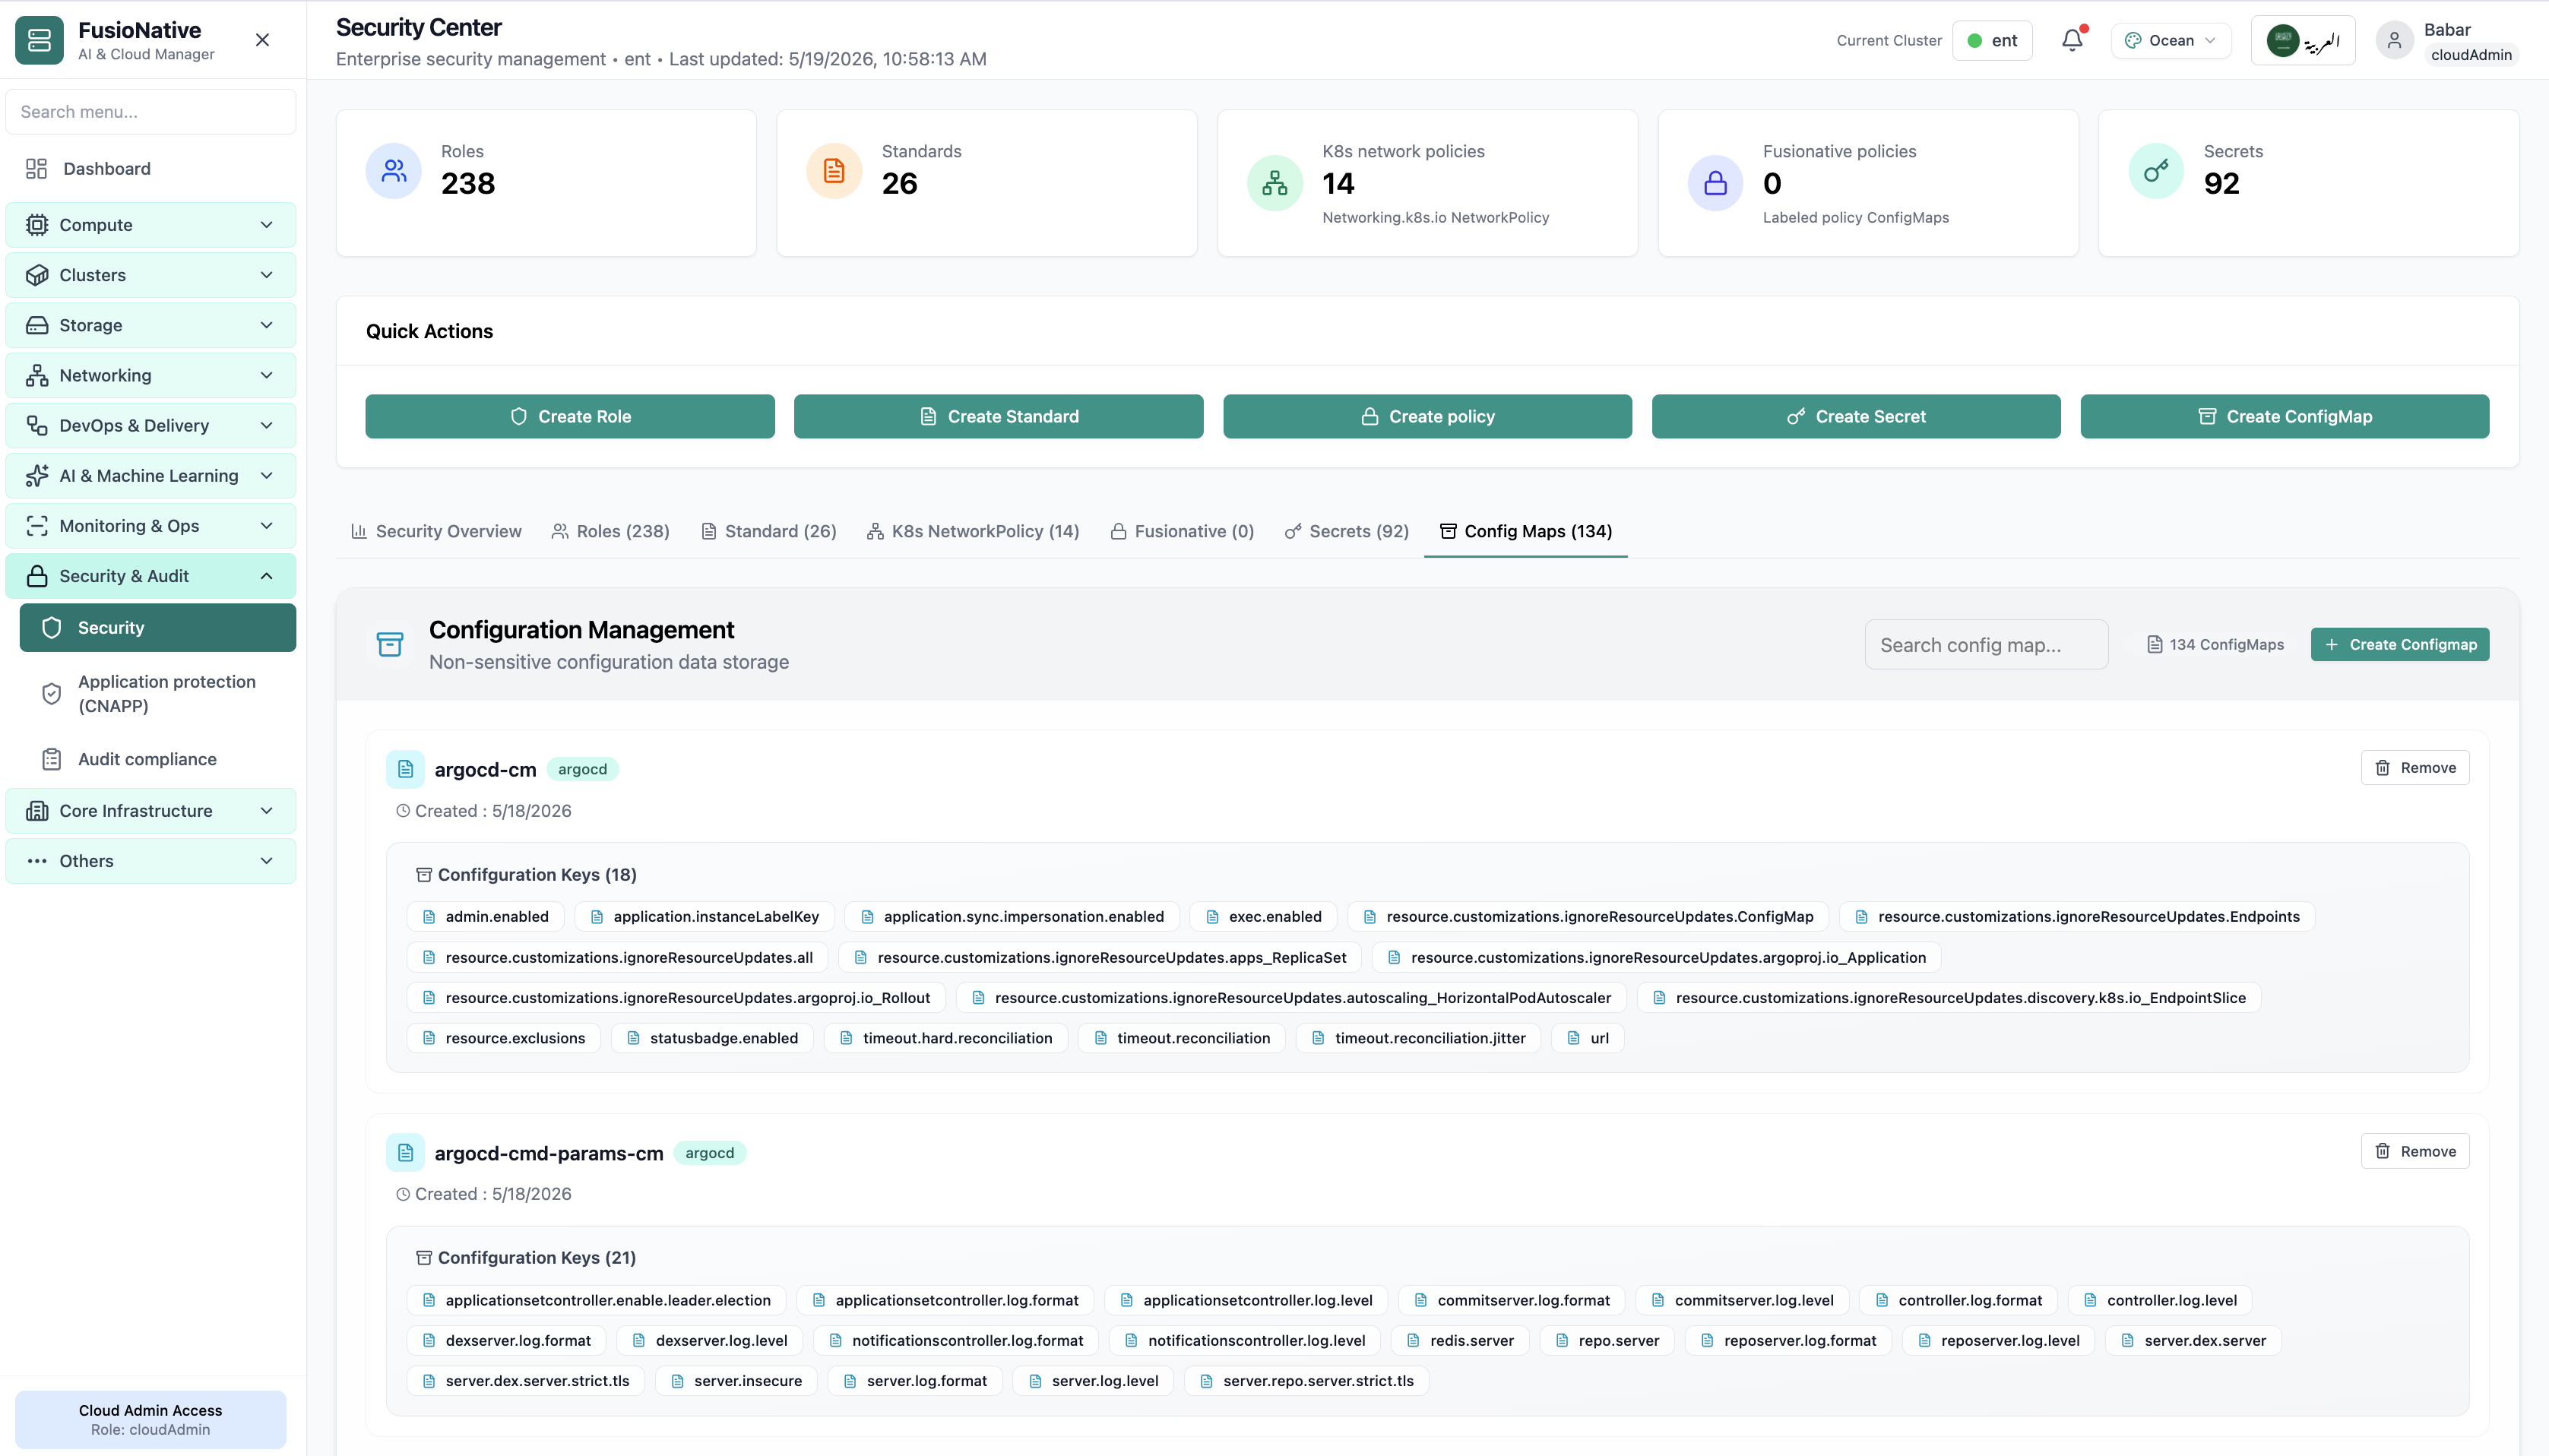
Open Security & Audit → Security for the Security Center: live counts for roles, standards, Kubernetes NetworkPolicies, Fusionative policies, and secrets; quick actions to create roles, standards, policies, secrets, and ConfigMaps; tabbed drill-downs; analytics tiles for namespaces, bindings, service accounts, and data objects, plus audit logging context and Pod Security admission visibility.

Product walkthrough

See it in Cloud Admin

Screens from the live product, with a short note on when you would open each view.

Security center overview and analytics.
01of 06Cloud Admin

Security Center

Security center overview and analytics.

  • Same layout your operators see in production
  • Click to zoom in
  • Works alongside the rest of Cloud Admin

Click the screenshot to open full size, zoom, and pan.
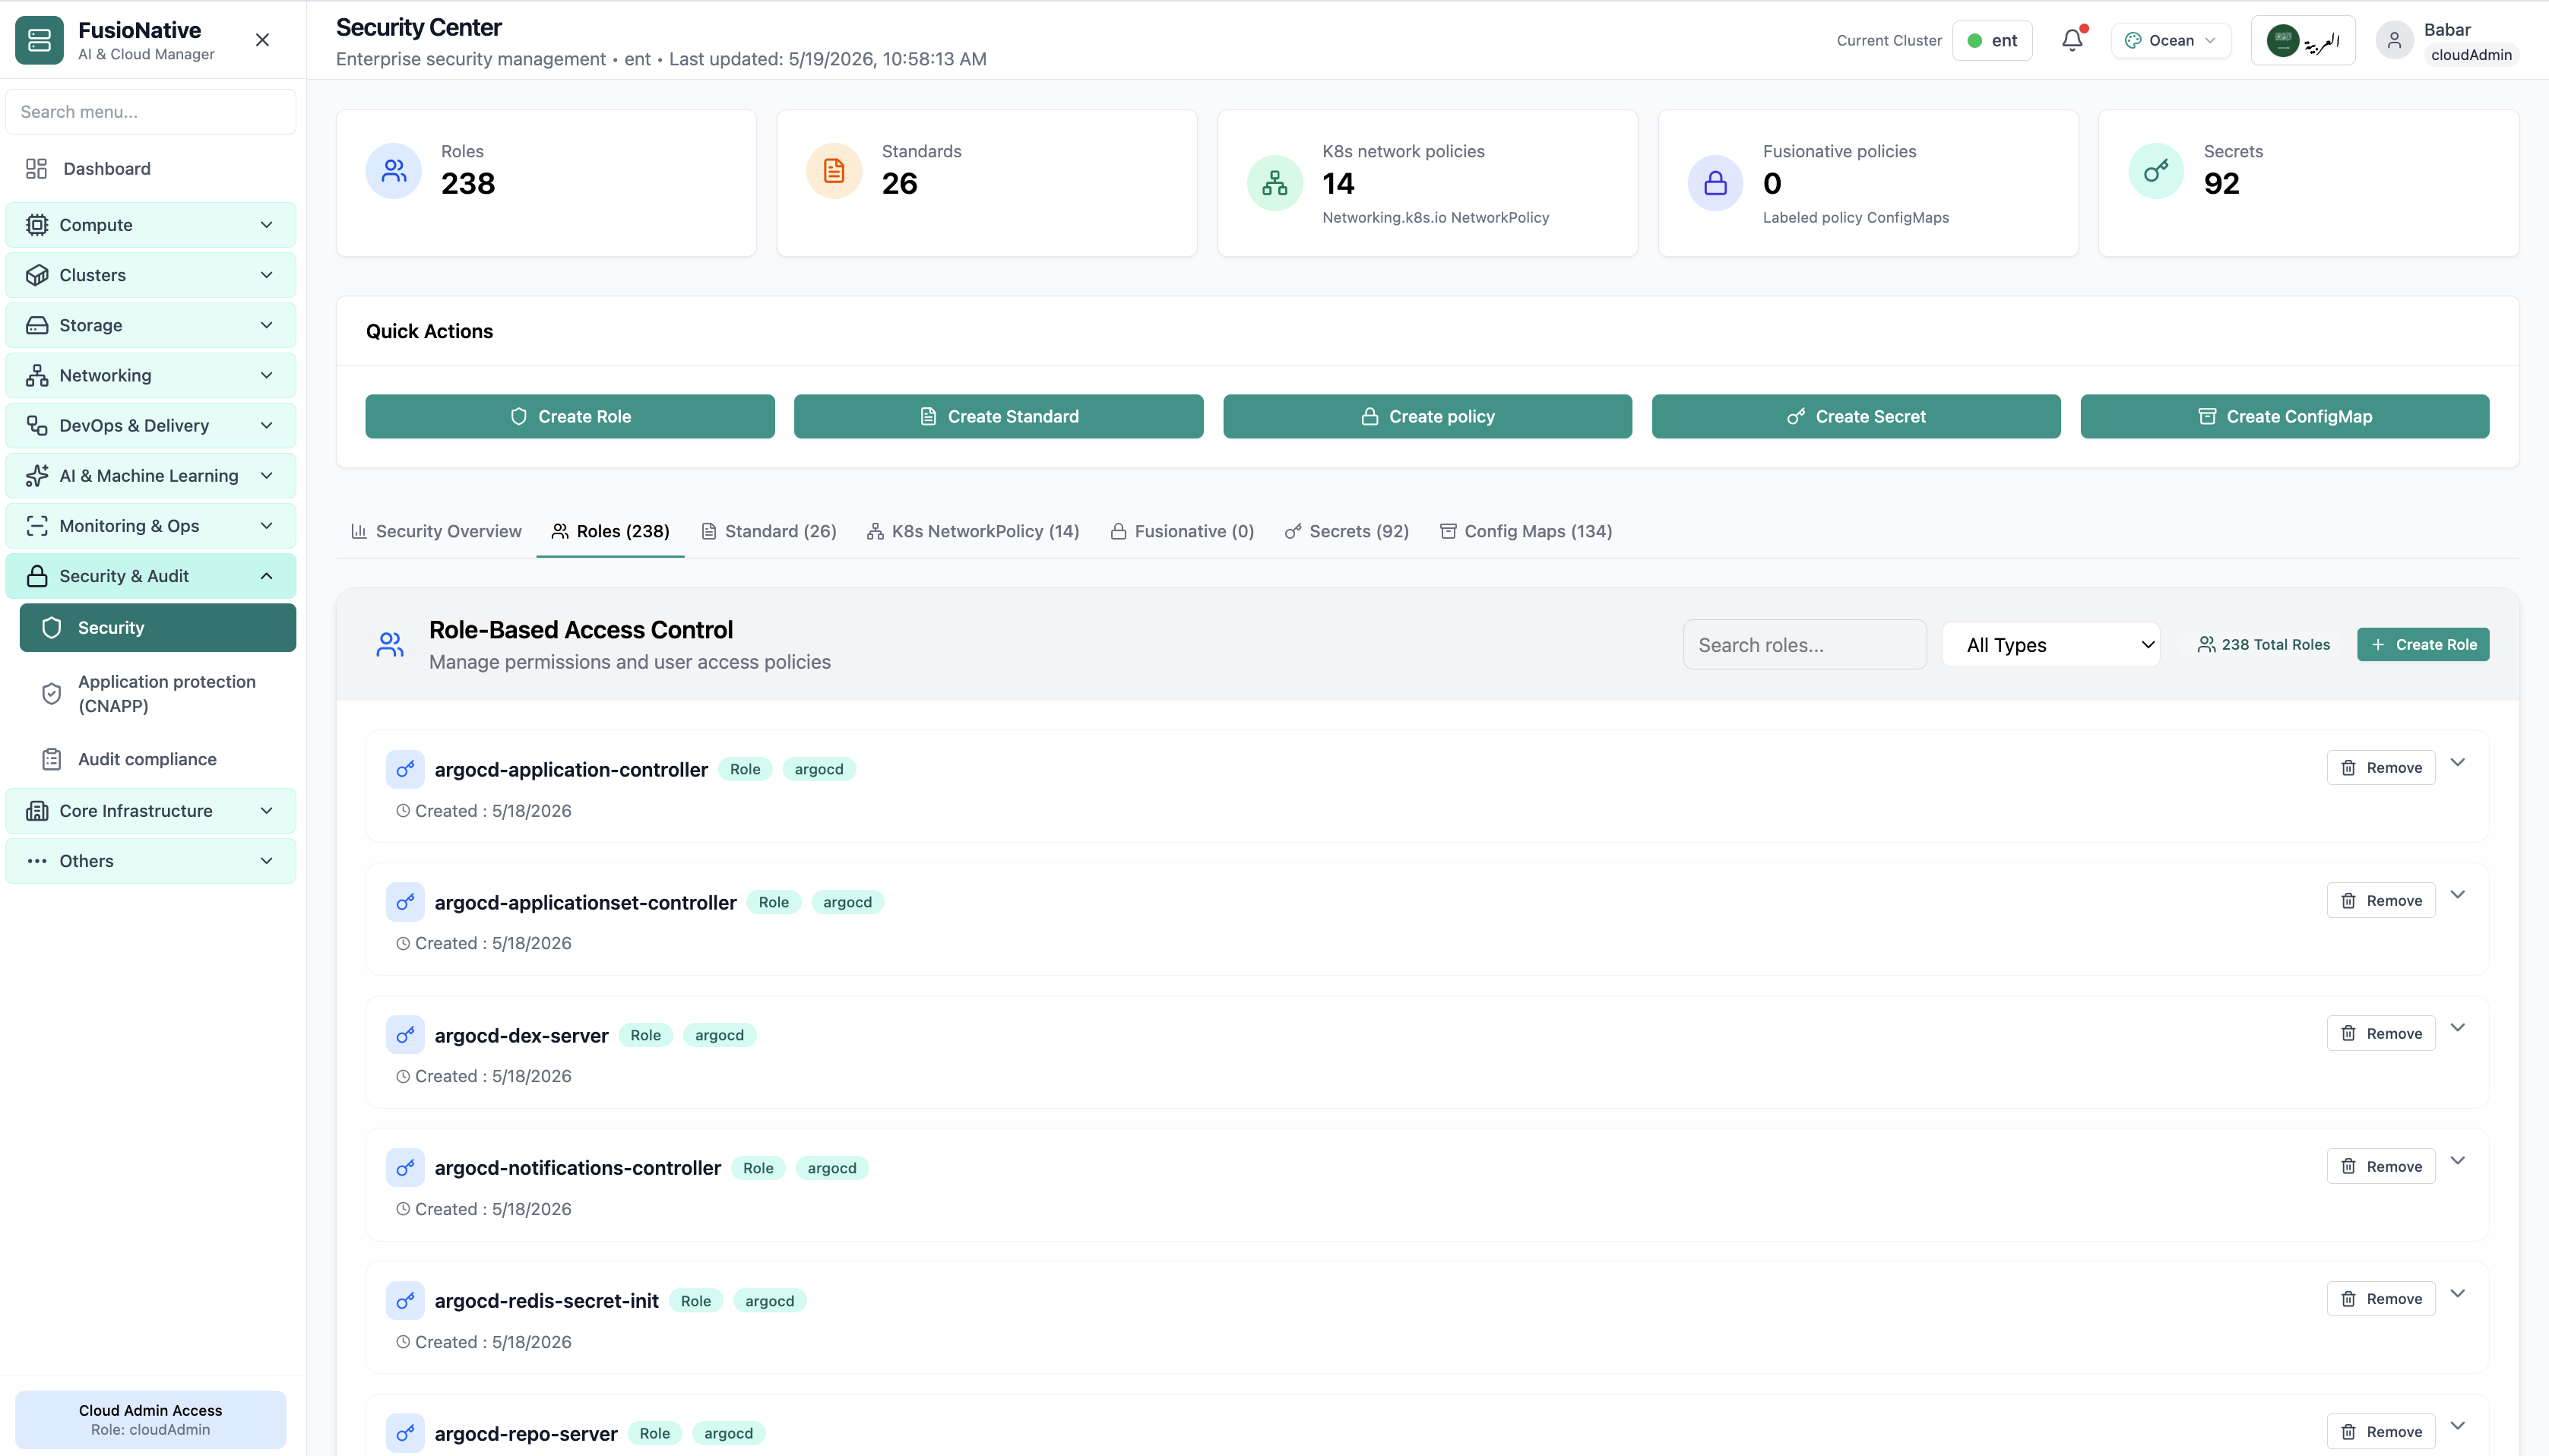
Kubernetes RBAC roles list.
02of 06Cloud Admin

Roles

Kubernetes RBAC roles list.

  • Same layout your operators see in production
  • Click to zoom in
  • Works alongside the rest of Cloud Admin

Click the screenshot to open full size, zoom, and pan.
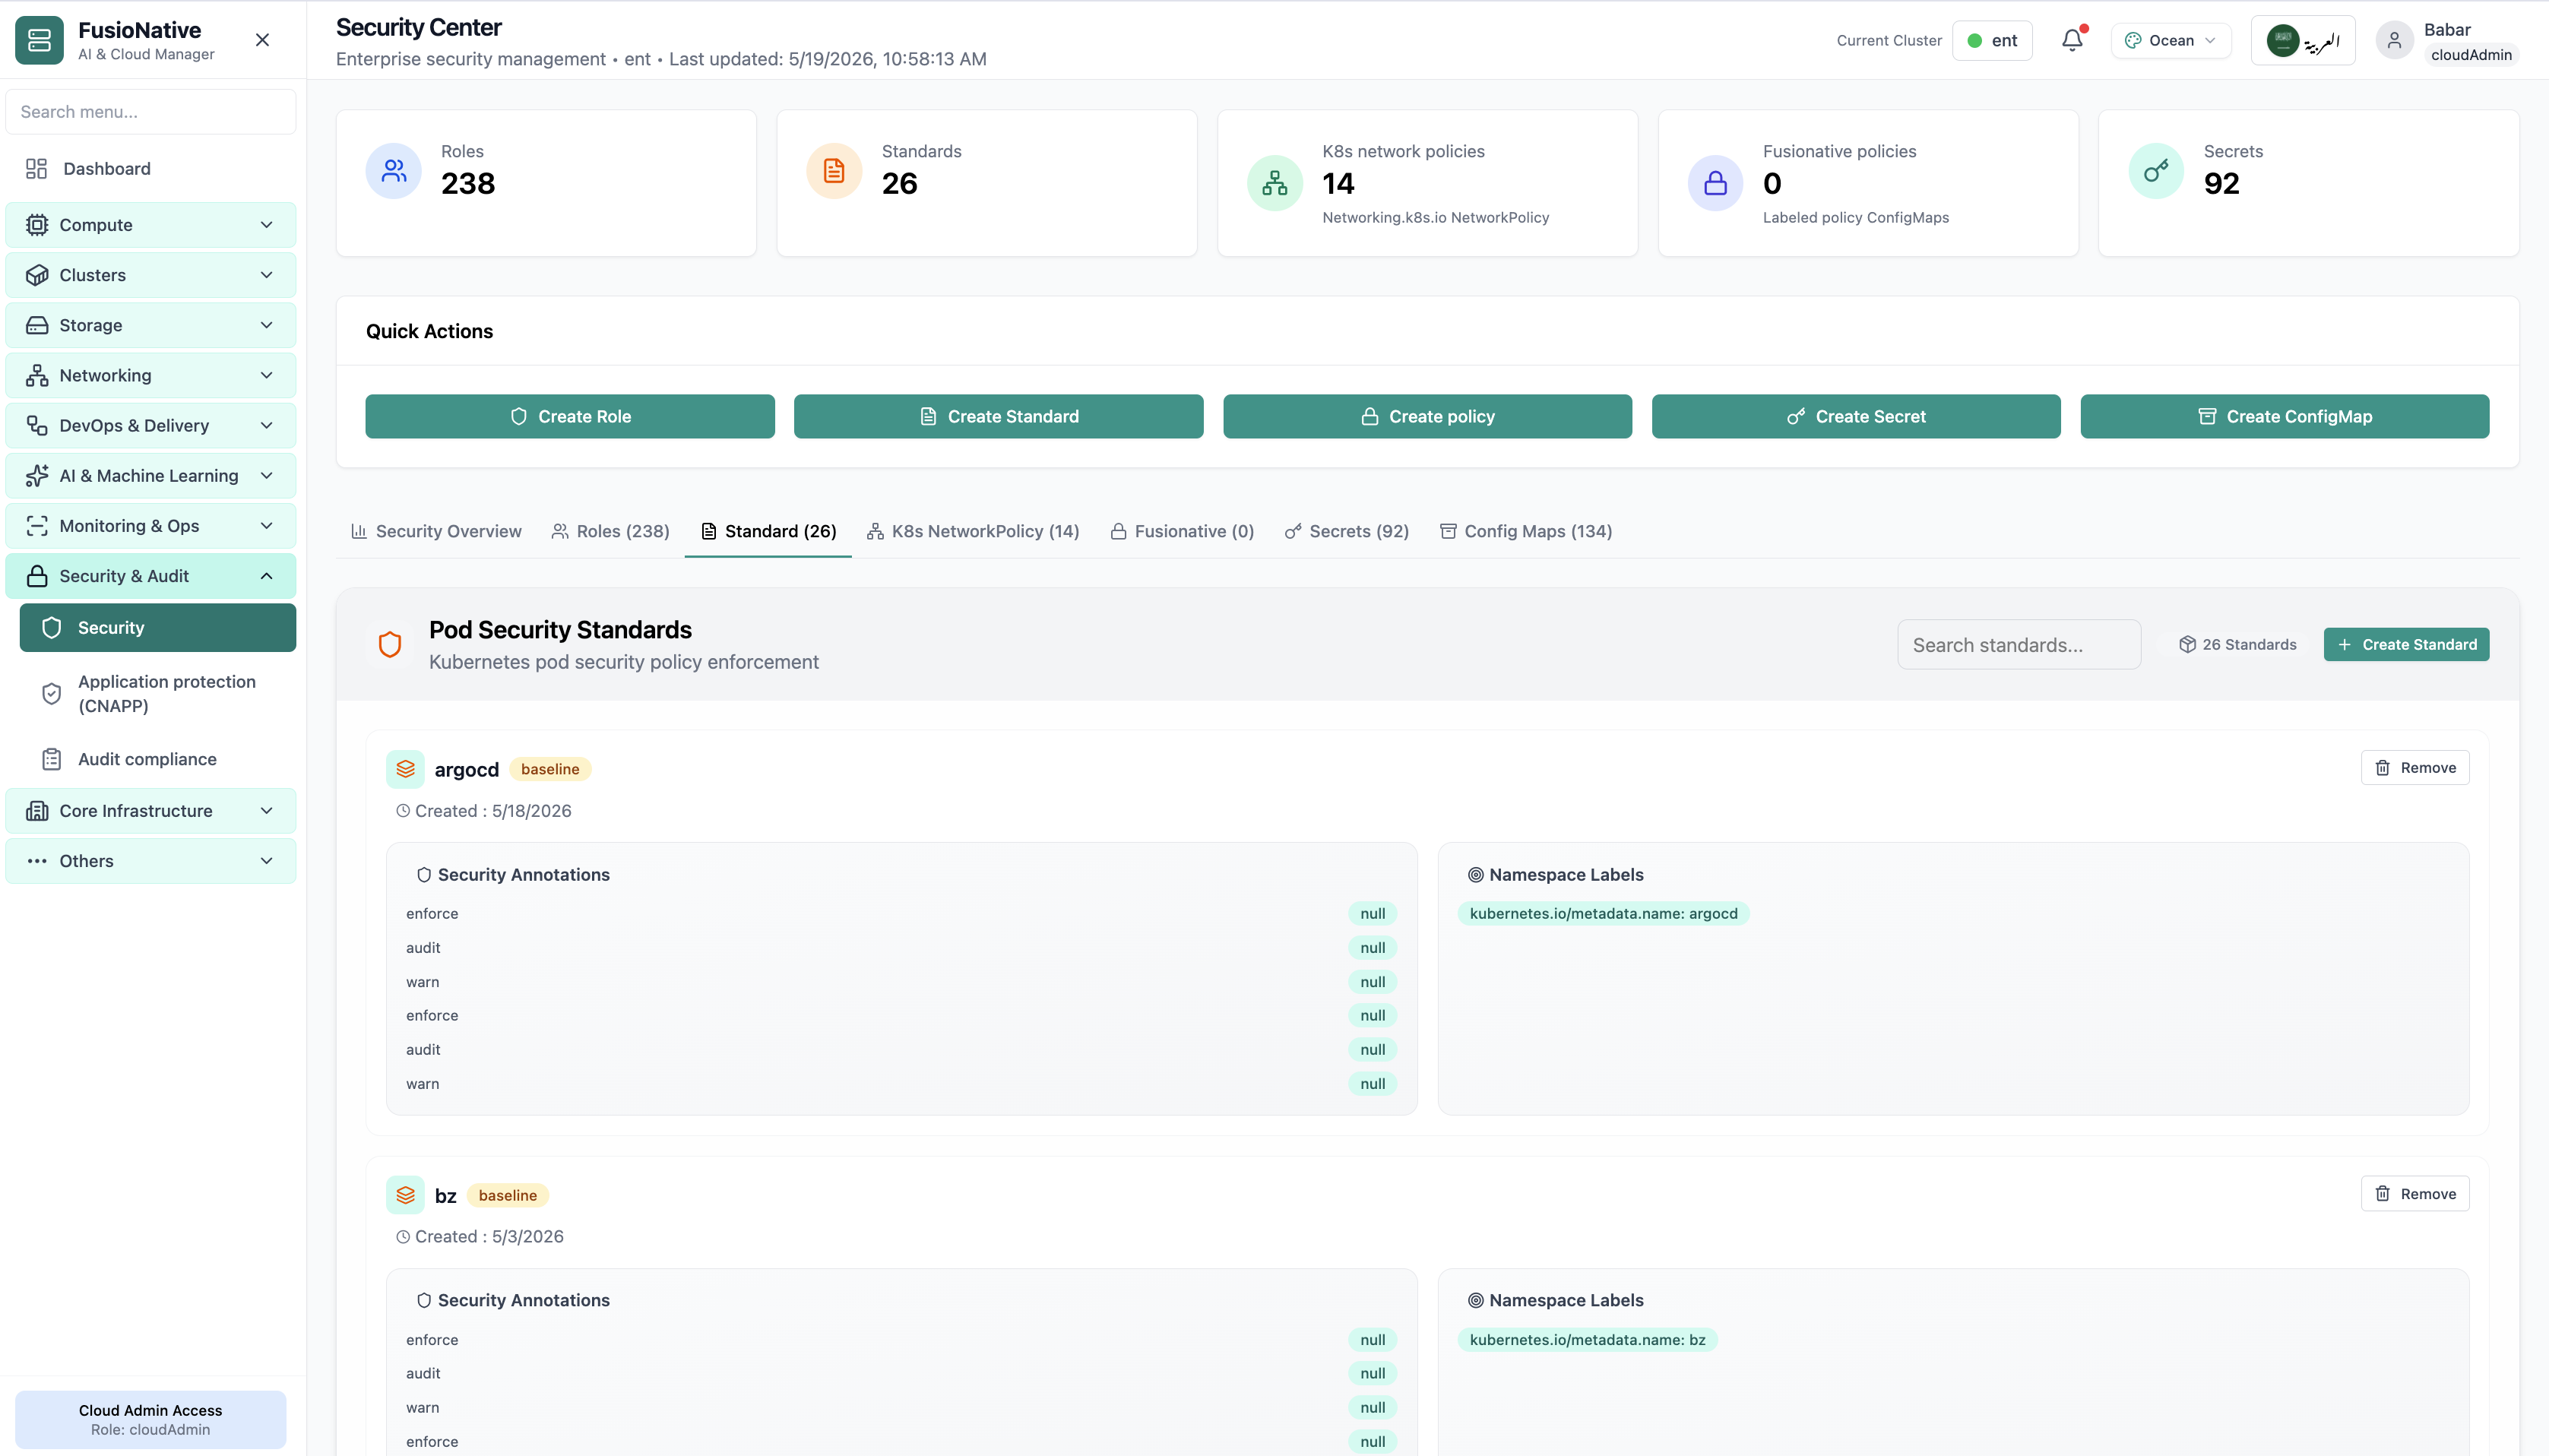
Pod security standards enforcement.
03of 06Cloud Admin

Pod Security Standards

Pod security standards enforcement.

  • Same layout your operators see in production
  • Click to zoom in
  • Works alongside the rest of Cloud Admin

Click the screenshot to open full size, zoom, and pan.
Kubernetes network policies tab.
04of 06Cloud Admin

Network Policies

Kubernetes network policies tab.

  • Same layout your operators see in production
  • Click to zoom in
  • Works alongside the rest of Cloud Admin

Click the screenshot to open full size, zoom, and pan.
Secrets management in security center.
05of 06Cloud Admin

Secrets

Secrets management in security center.

  • Same layout your operators see in production
  • Click to zoom in
  • Works alongside the rest of Cloud Admin

Click the screenshot to open full size, zoom, and pan.
ConfigMaps in security center.
06of 06Cloud Admin

Config Maps

ConfigMaps in security center.

  • Same layout your operators see in production
  • Click to zoom in
  • Works alongside the rest of Cloud Admin

Click the screenshot to open full size, zoom, and pan.
Governance loop

Measure posture, then close gaps without shadow IT

Security Center ties counts to actions, inventory informs standards; standards inform policies; policies and RBAC guard secrets and ConfigMaps, still inside the same Cloud Admin session finance and ops already trust.

Executive clarity

Ribbon metrics answer “how exposed are we?” without exporting kubectl dumps.

Operator velocity

Quick creates encode validation. Fewer broken YAML cycles during onboarding sprints.

Audit-ready linkage

Unified ingest counters preview how much evidence flows into Audit Compliance for frameworks like ISO/IEC 27001 and GDPR themes.

Security & Audit

Audit Compliance

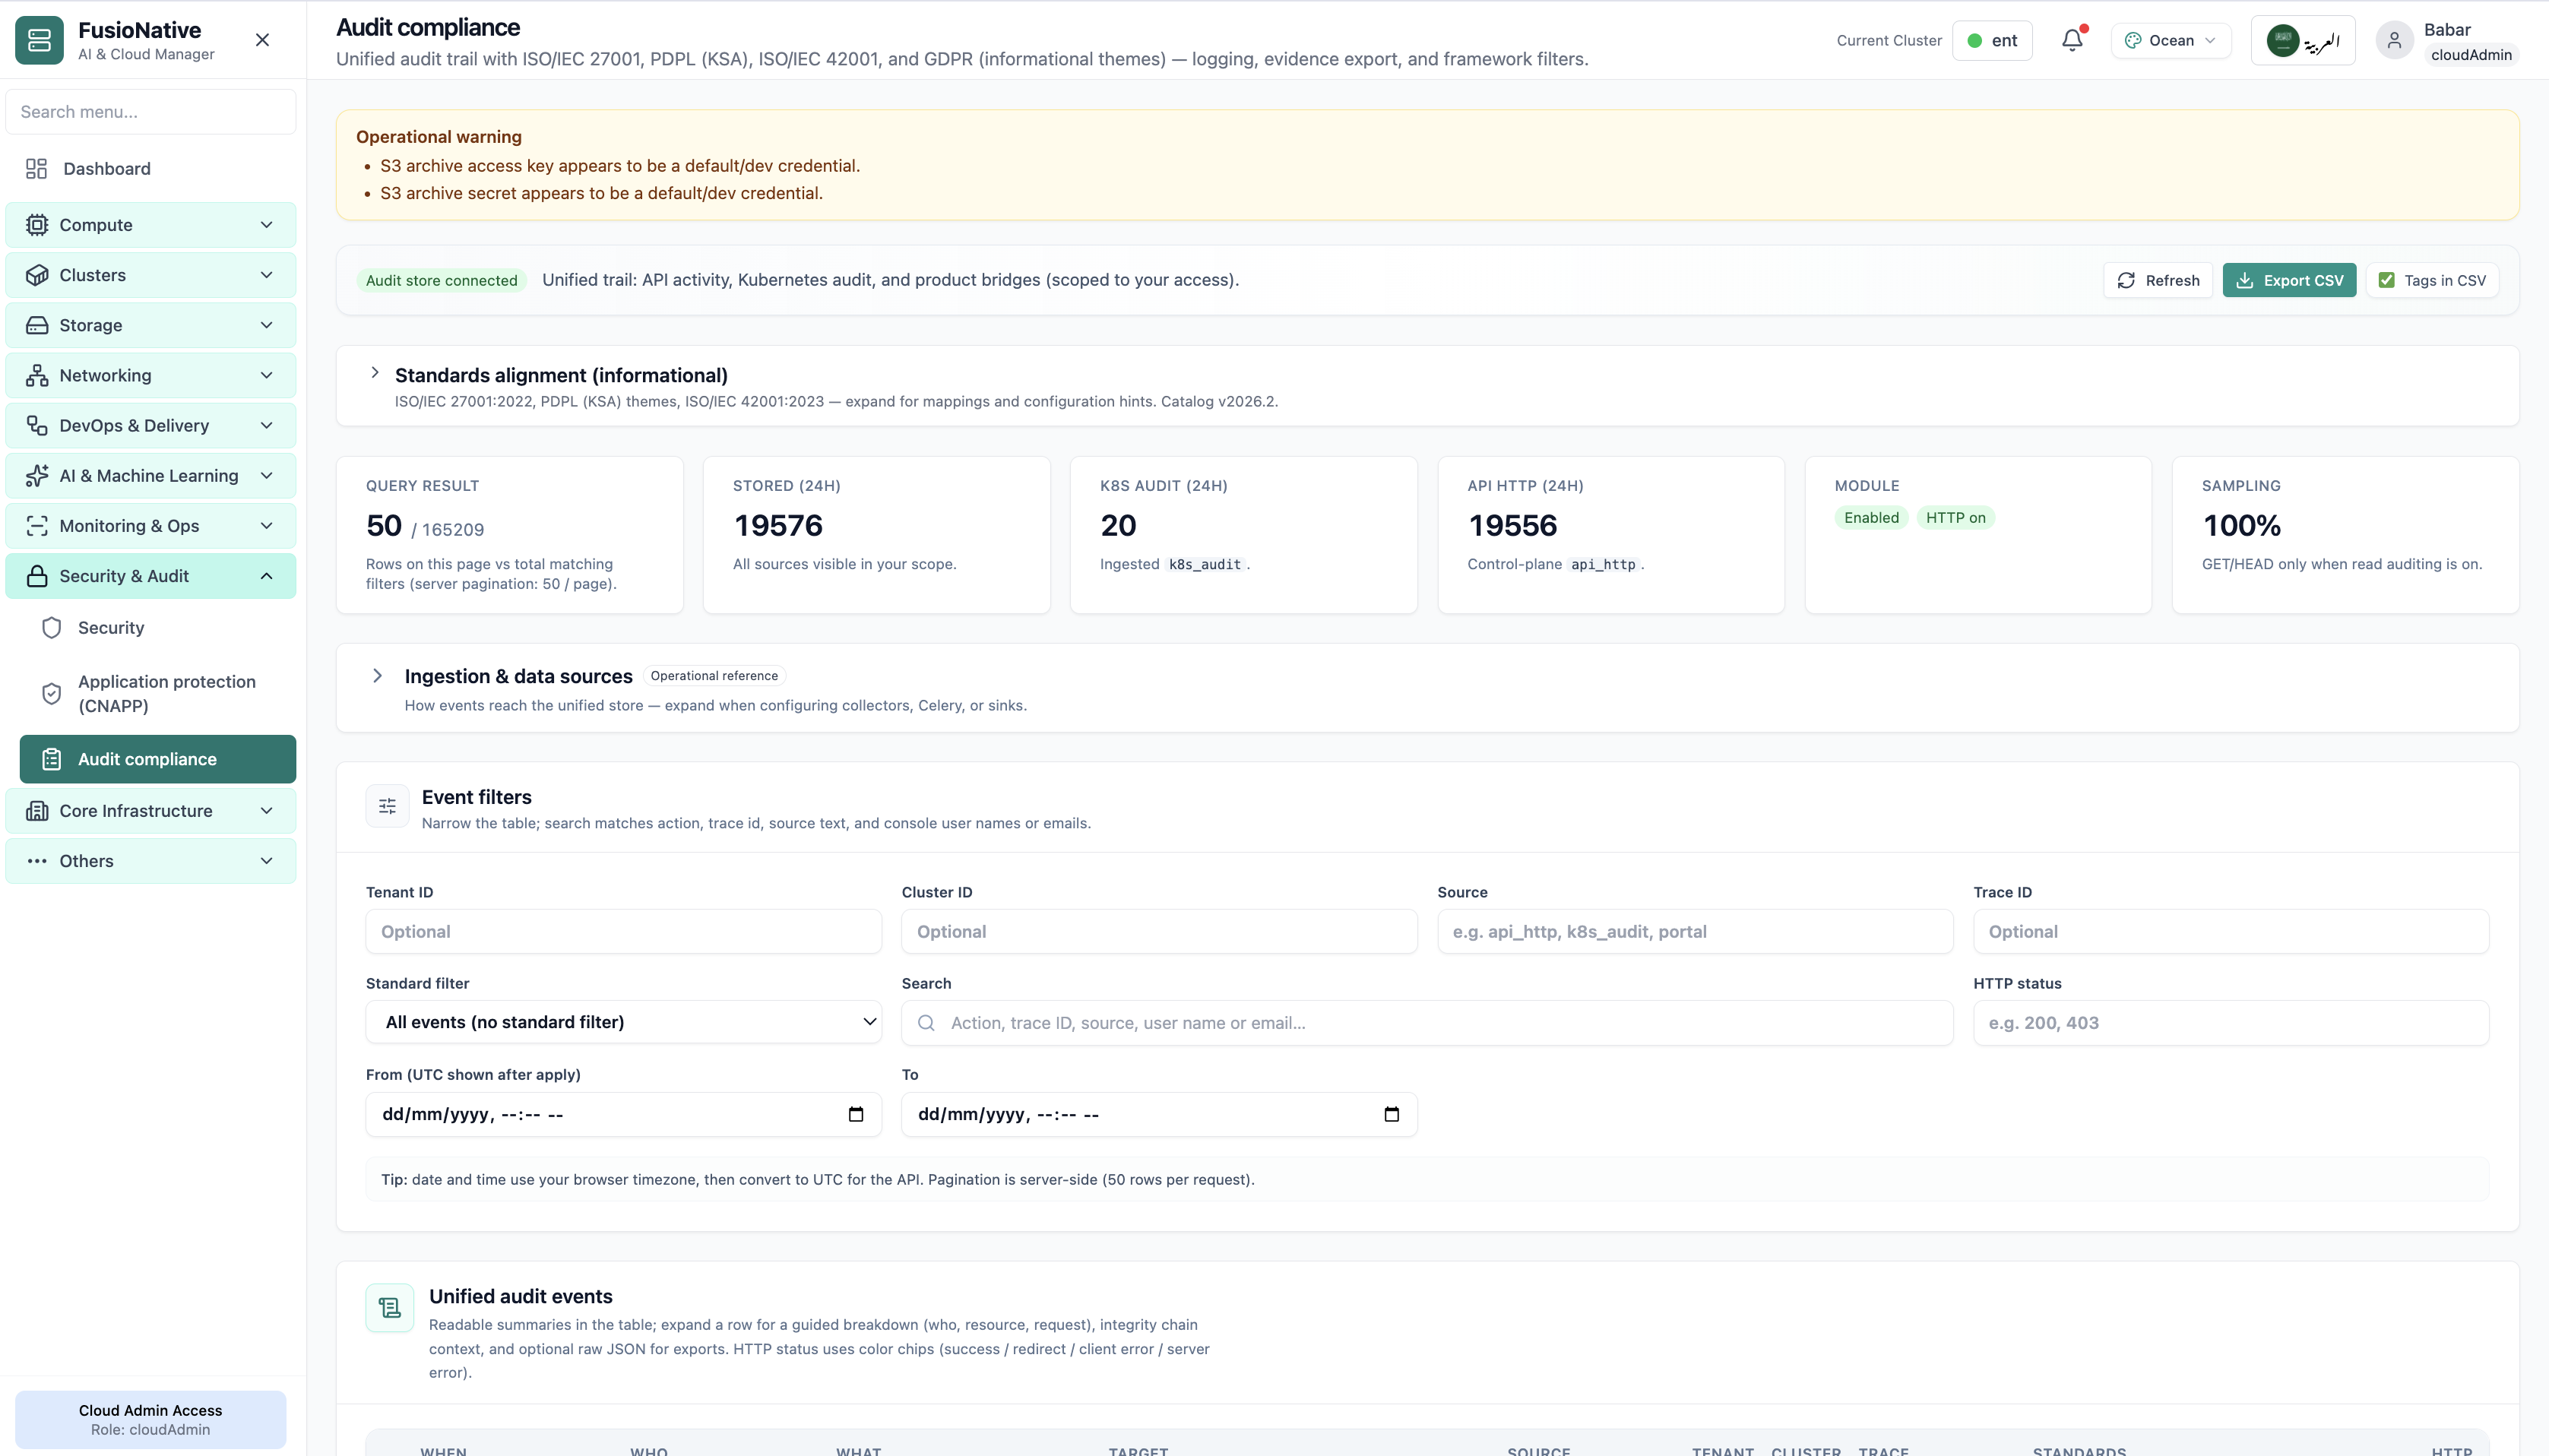
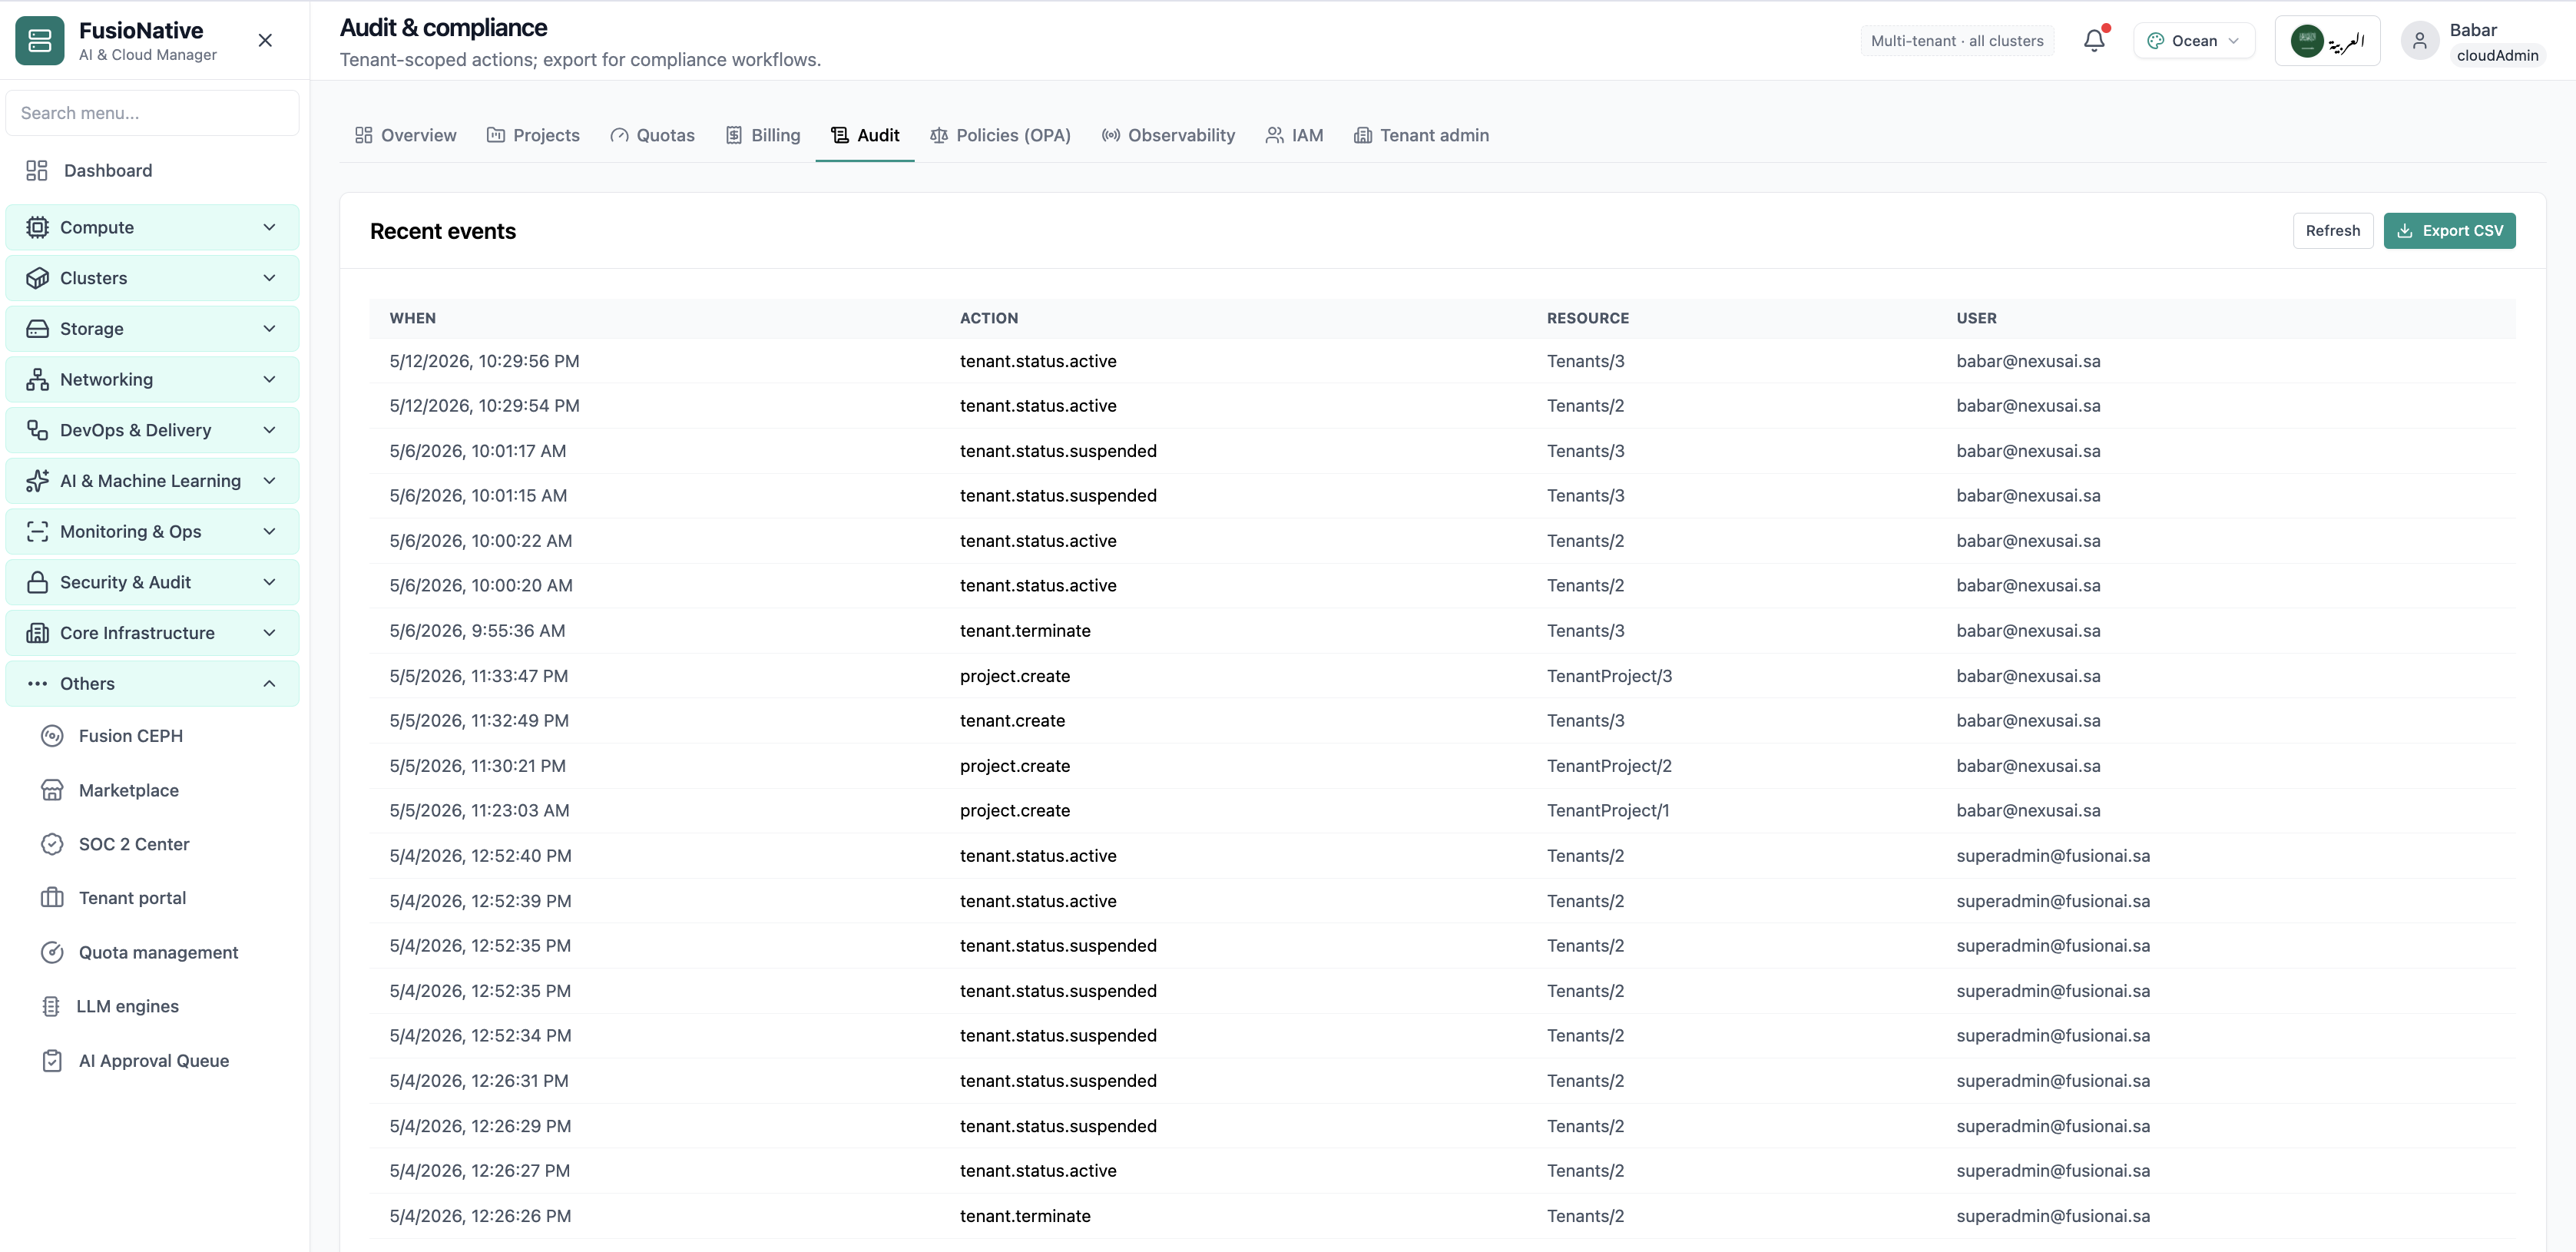
Under Security & Audit → Audit compliance, Cloud Admin aggregates API and control-plane signals into one queryable trail, aligned to informational themes for ISO/IEC 27001, PDPL (KSA), ISO/IEC 42001, and GDPR. Monitor ingest health, slice by tenant, cluster, source, trace, HTTP status, and framework filters, then export CSV (with optional tags) for auditors and SIEM pipelines.

Product walkthrough

See it in Cloud Admin

Screens from the live product, with a short note on when you would open each view.

Actionable signals instead of raw logs, unified audit trail with framework filters. Each item ties back to audit and compliance so owners know what to fix now versus what can wait.
01of 02Cloud Admin

Audit Compliance

Actionable signals instead of raw logs, unified audit trail with framework filters. Each item ties back to audit and compliance so owners know what to fix now versus what can wait.

  • Same layout your operators see in production
  • Click to zoom in
  • Works alongside the rest of Cloud Admin

Click the screenshot to open full size, zoom, and pan.
Actionable signals instead of raw logs, tenant-scoped audit events and export. Each item ties back to audit and compliance so owners know what to fix now versus what can wait.
02of 02Cloud Admin

Tenant Audit

Actionable signals instead of raw logs, tenant-scoped audit events and export. Each item ties back to audit and compliance so owners know what to fix now versus what can wait.

  • Per-organization limits visible to admins and tenants
  • Usage meters explain who is consuming shared capacity
  • Supports chargeback and fair-share policy conversations

Click the screenshot to open full size, zoom, and pan.
Evidence discipline

Make compliance investigations repeatable

Audit Compliance closes the loop between “we log everything somewhere” and “here is the CSV with tenant, cluster, trace, and framework filters your auditor requested.”

Export-ready rows

CSV exports carry structured tags when enabled. Fewer manual joins before Splunk or BigQuery handoff.

Honest sampling

Sampling percentage is visible, legal and engineering agree what fraction of reality each report represents.

Guardrails on archives

Inline alerts flag risky default credentials on archive paths before exports leak into the wrong bucket lifecycle.