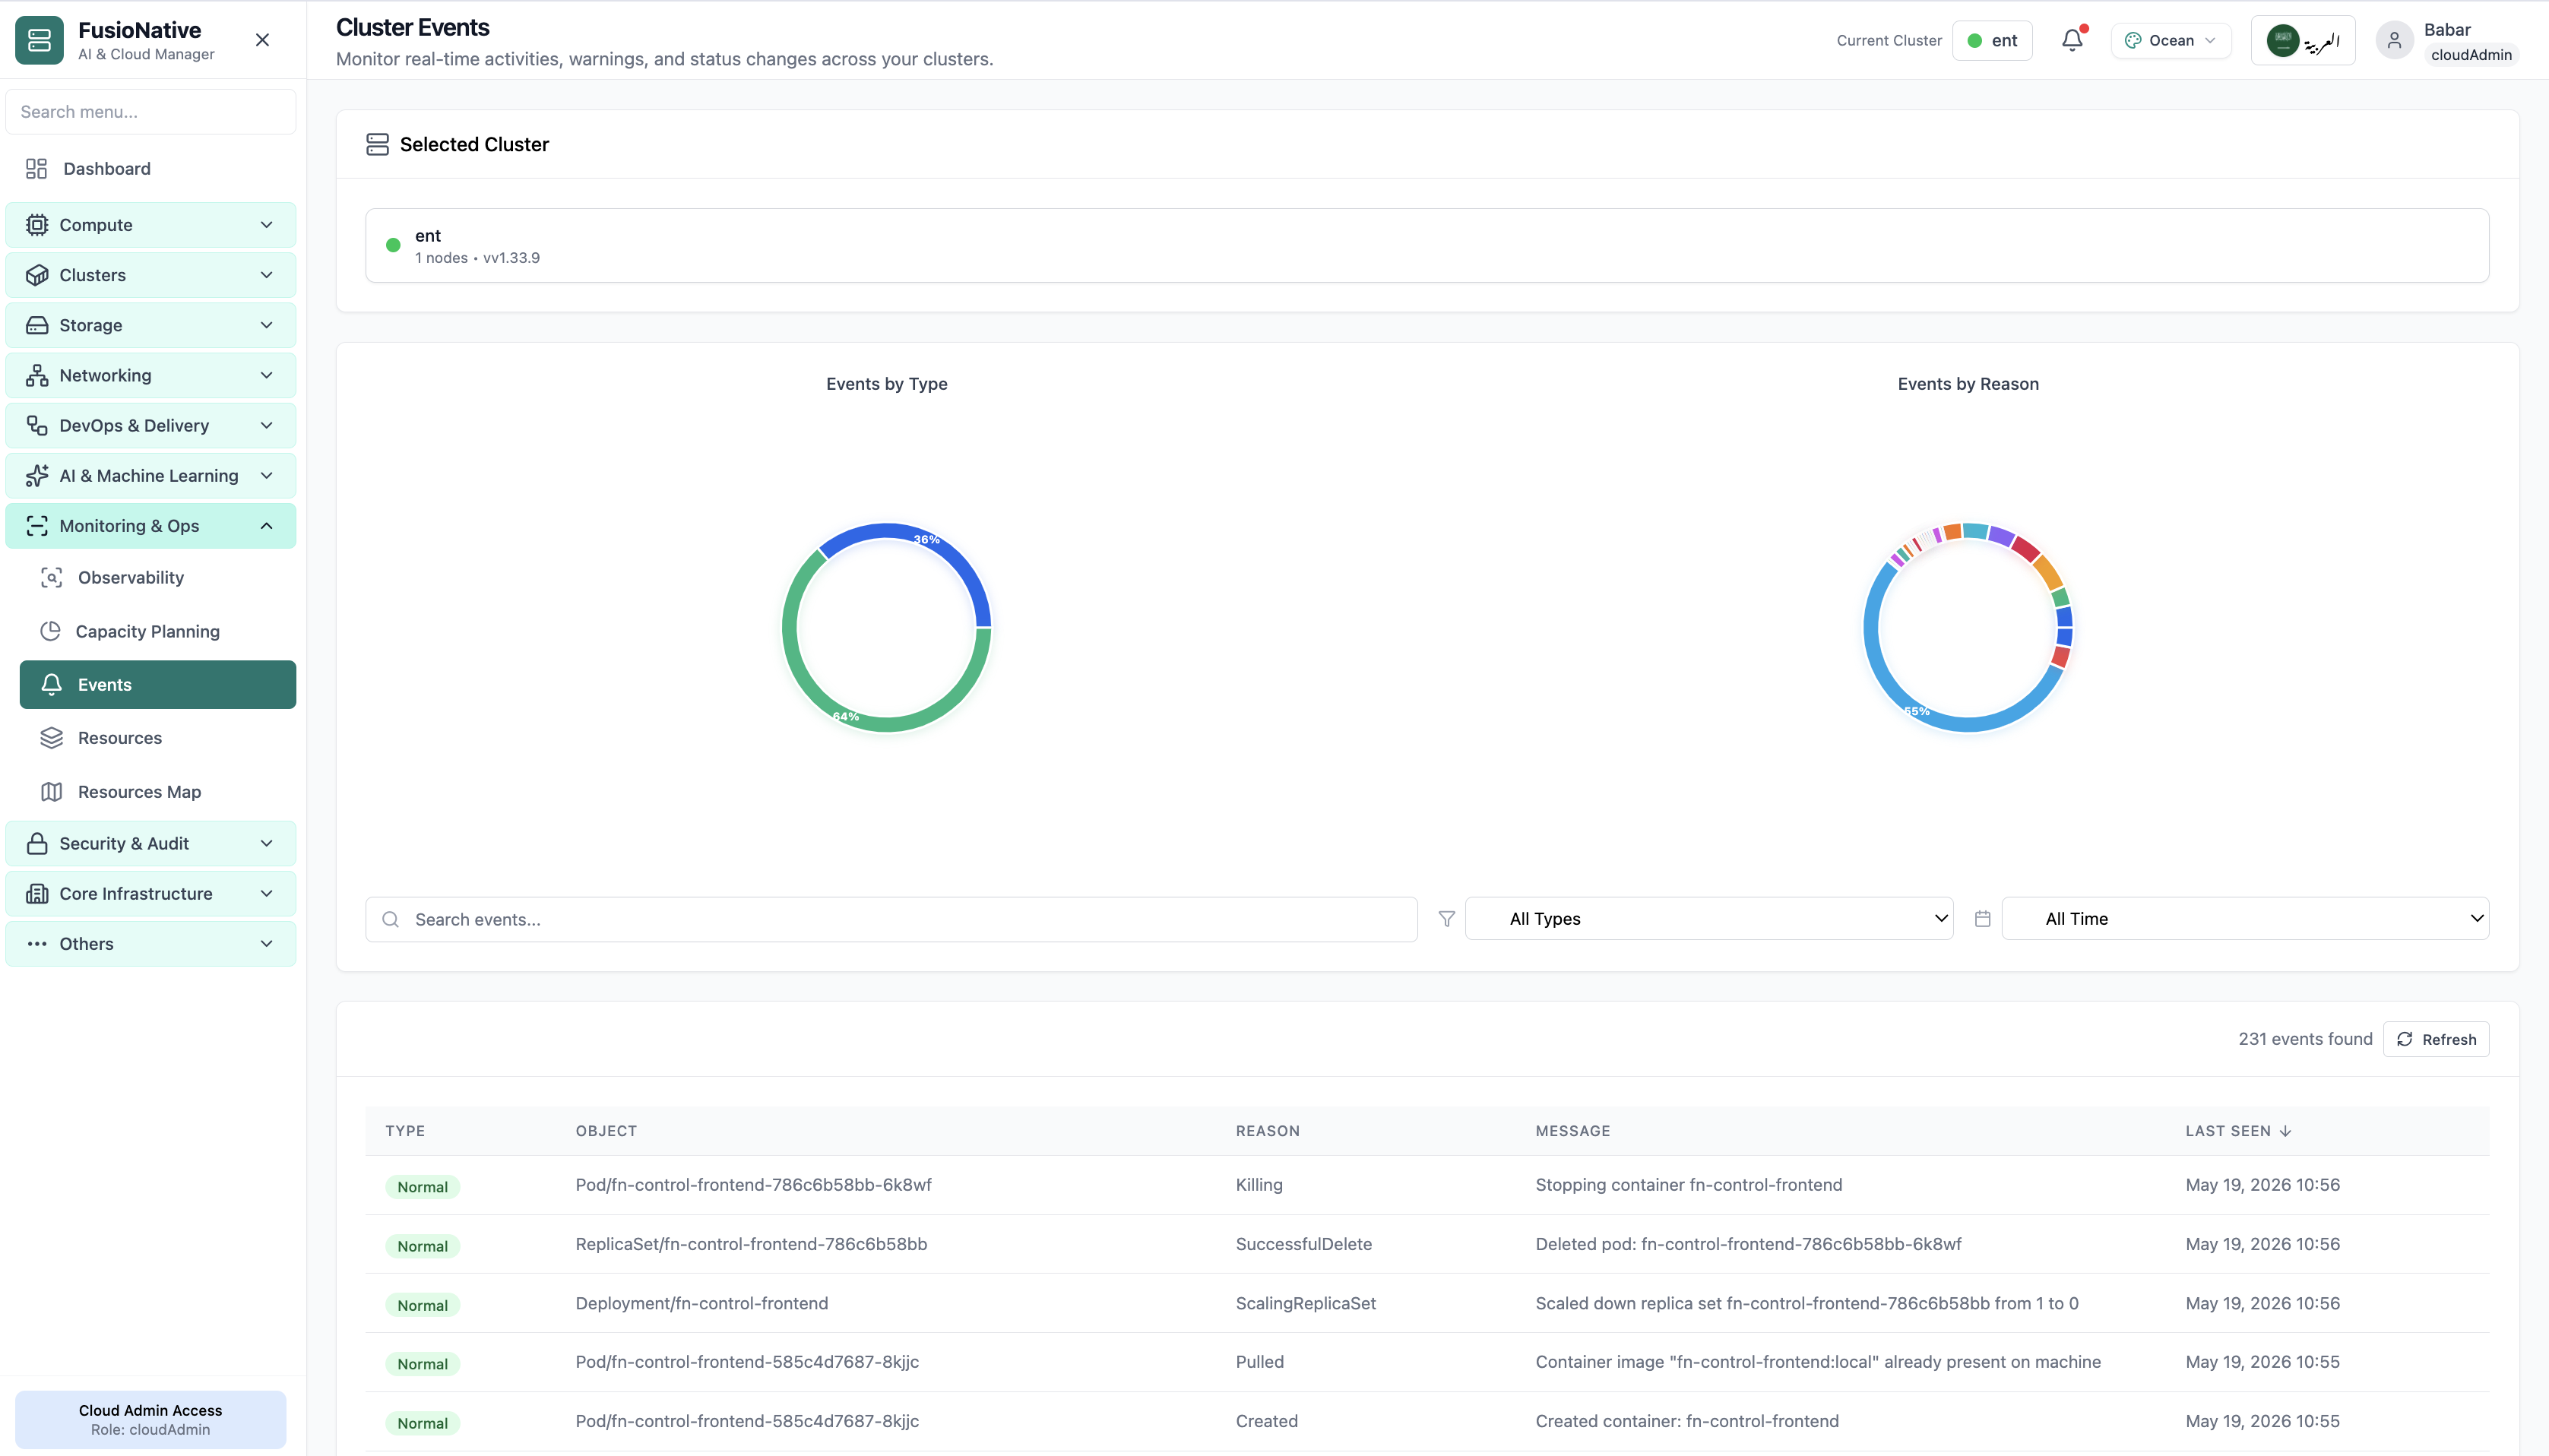
Cluster Events
Cluster events charts and searchable event table.
- Same layout your operators see in production
- Click to zoom in
- Works alongside the rest of Cloud Admin
Click the screenshot to open full size, zoom, and pan.
Monitoring & Ops
Open Monitoring & Ops → Events to watch Kubernetes events as they happen: cluster-scoped context, type/reason distributions, rich filters, and a searchable table, ideal when logs are noisy but the API surface tells the truth.
Screens from the live product, with a short note on when you would open each view.
Cluster events charts and searchable event table.
Click the screenshot to open full size, zoom, and pan.
Events become actionable when everyone sees the same Normal/Warning profile, reasons cluster visibly, and filters isolate the blast radius, without copying kubectl output into chat.
Donut charts give executives the headline mix while engineers stay in the detailed table.
Warning badges and reasons isolate kubelet and scheduler narratives before you grep terabytes of stdout.
Switch clusters without breaking context, Monitoring & Ops routes stay consistent.