Industry · DevOps & SRE

DevOps & SRE: see failure before the page

SREs live in graphs and event streams—but only if they trust the data and can stay inside one environment as they drill down. FusioNative connects live metrics, cluster events, and resource views without losing cluster scope.

Metrics, events, and reliability without tab overload

Correlate metrics, events, and workloads on the same cluster context during incidents and reviews.

Who needs this

  • SREs on-call for production and shared services
  • DevOps engineers owning observability baselines
  • Incident commanders who need one screen for the bridge

Industry pressures (why change)

  • Metrics tools and ticketing systems disagree during outages
  • Event noise hides the few cluster-scoped signals that matter
  • Drill-down tools forget which cluster you started in

Why FusioNative fits

  • Live metrics and performance analytics with 24h history
  • Cluster events filtered by type, reason, and namespace
  • Resources map and cluster resources keep topology readable

How teams adopt it

  1. Baseline golden signals per critical cluster
  2. Wire cluster events into triage—filter to warnings and failures first
  3. Drill from fleet health into namespaces and pods without re-selecting context
  4. Feed capacity findings back to platform after every major incident
In Cloud Admin

What DevOps & SRE teams see in the product

Product screens with notes on when each view matters for your sector.
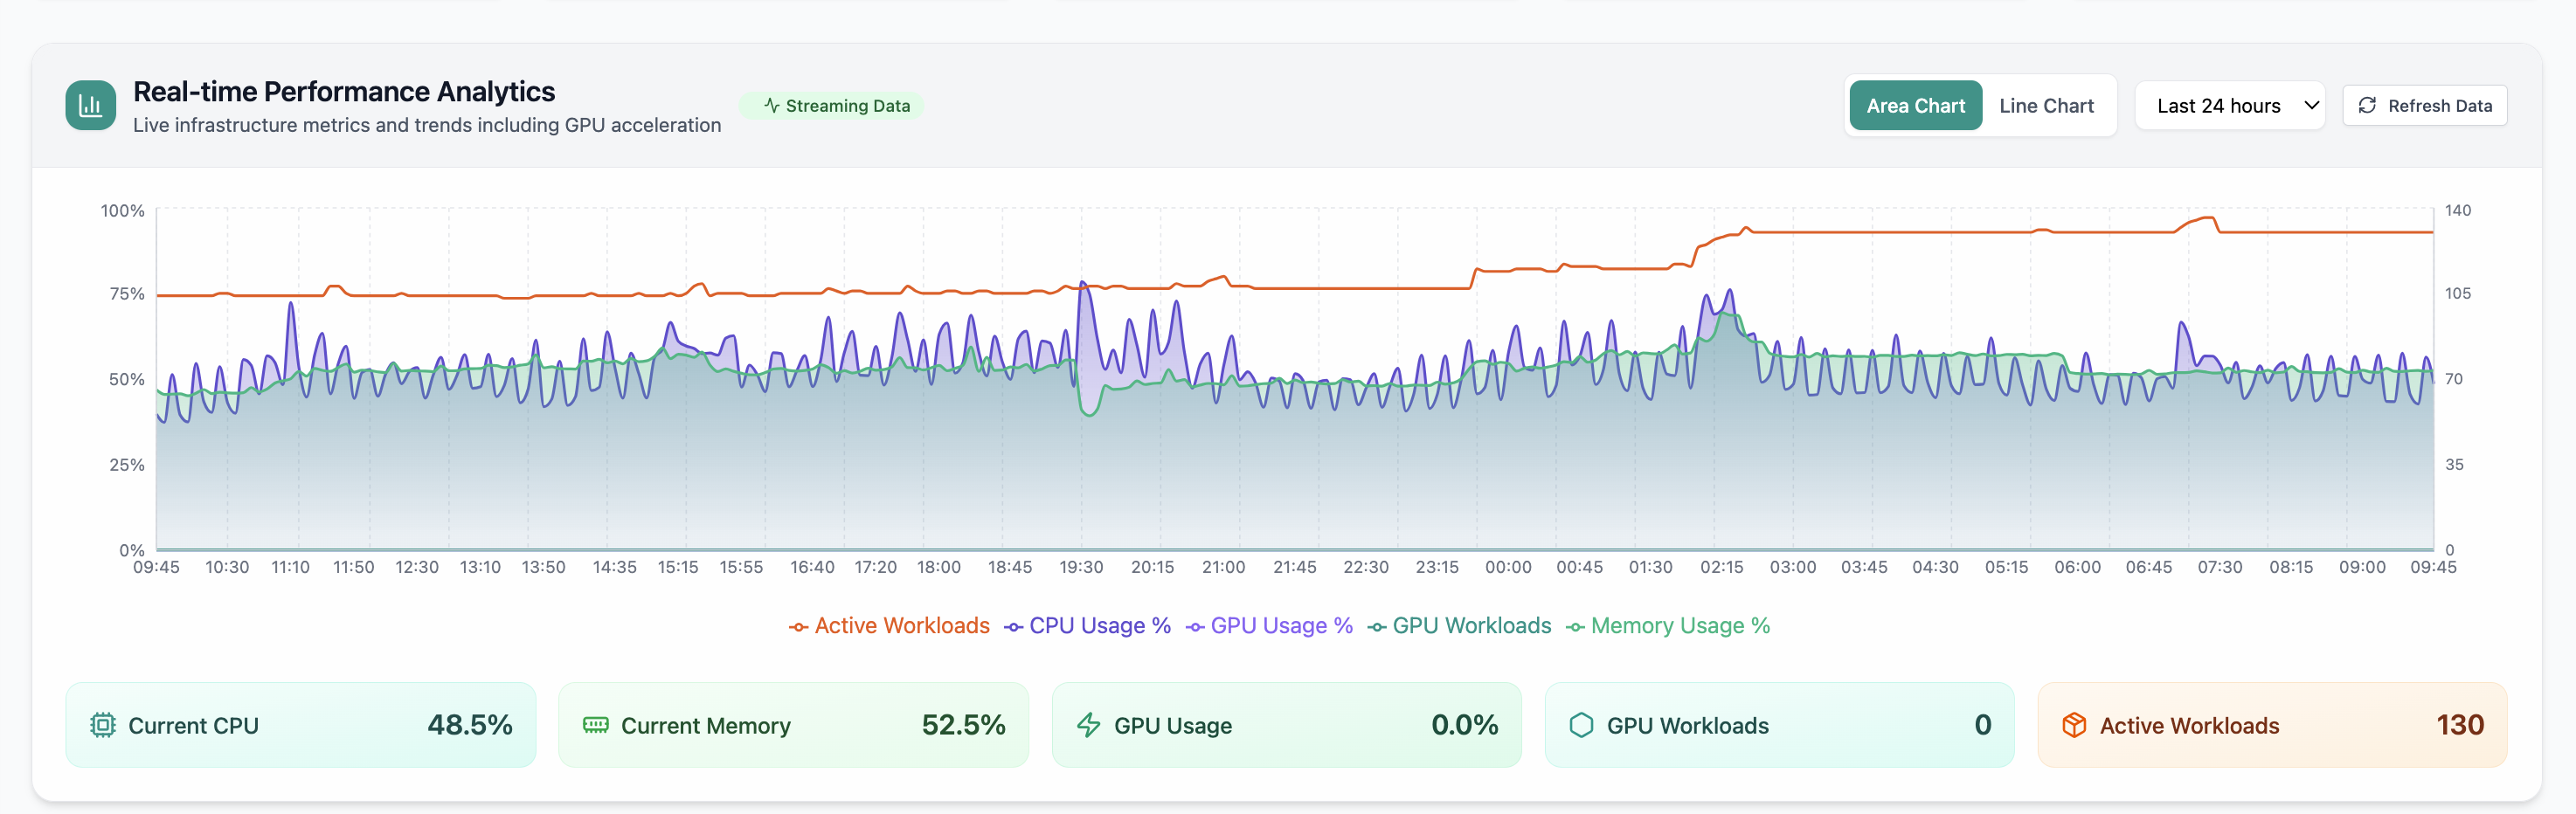
Fleet-wide utilization charts—the first screen in many incident bridges.
01of 03Cloud Admin

Performance analytics

Fleet-wide utilization charts—the first screen in many incident bridges.

  • CPU, memory, GPU in one timeline
  • Spot anomalies quickly
  • Links to deeper tabs

Click the screenshot to open full size, zoom, and pan.
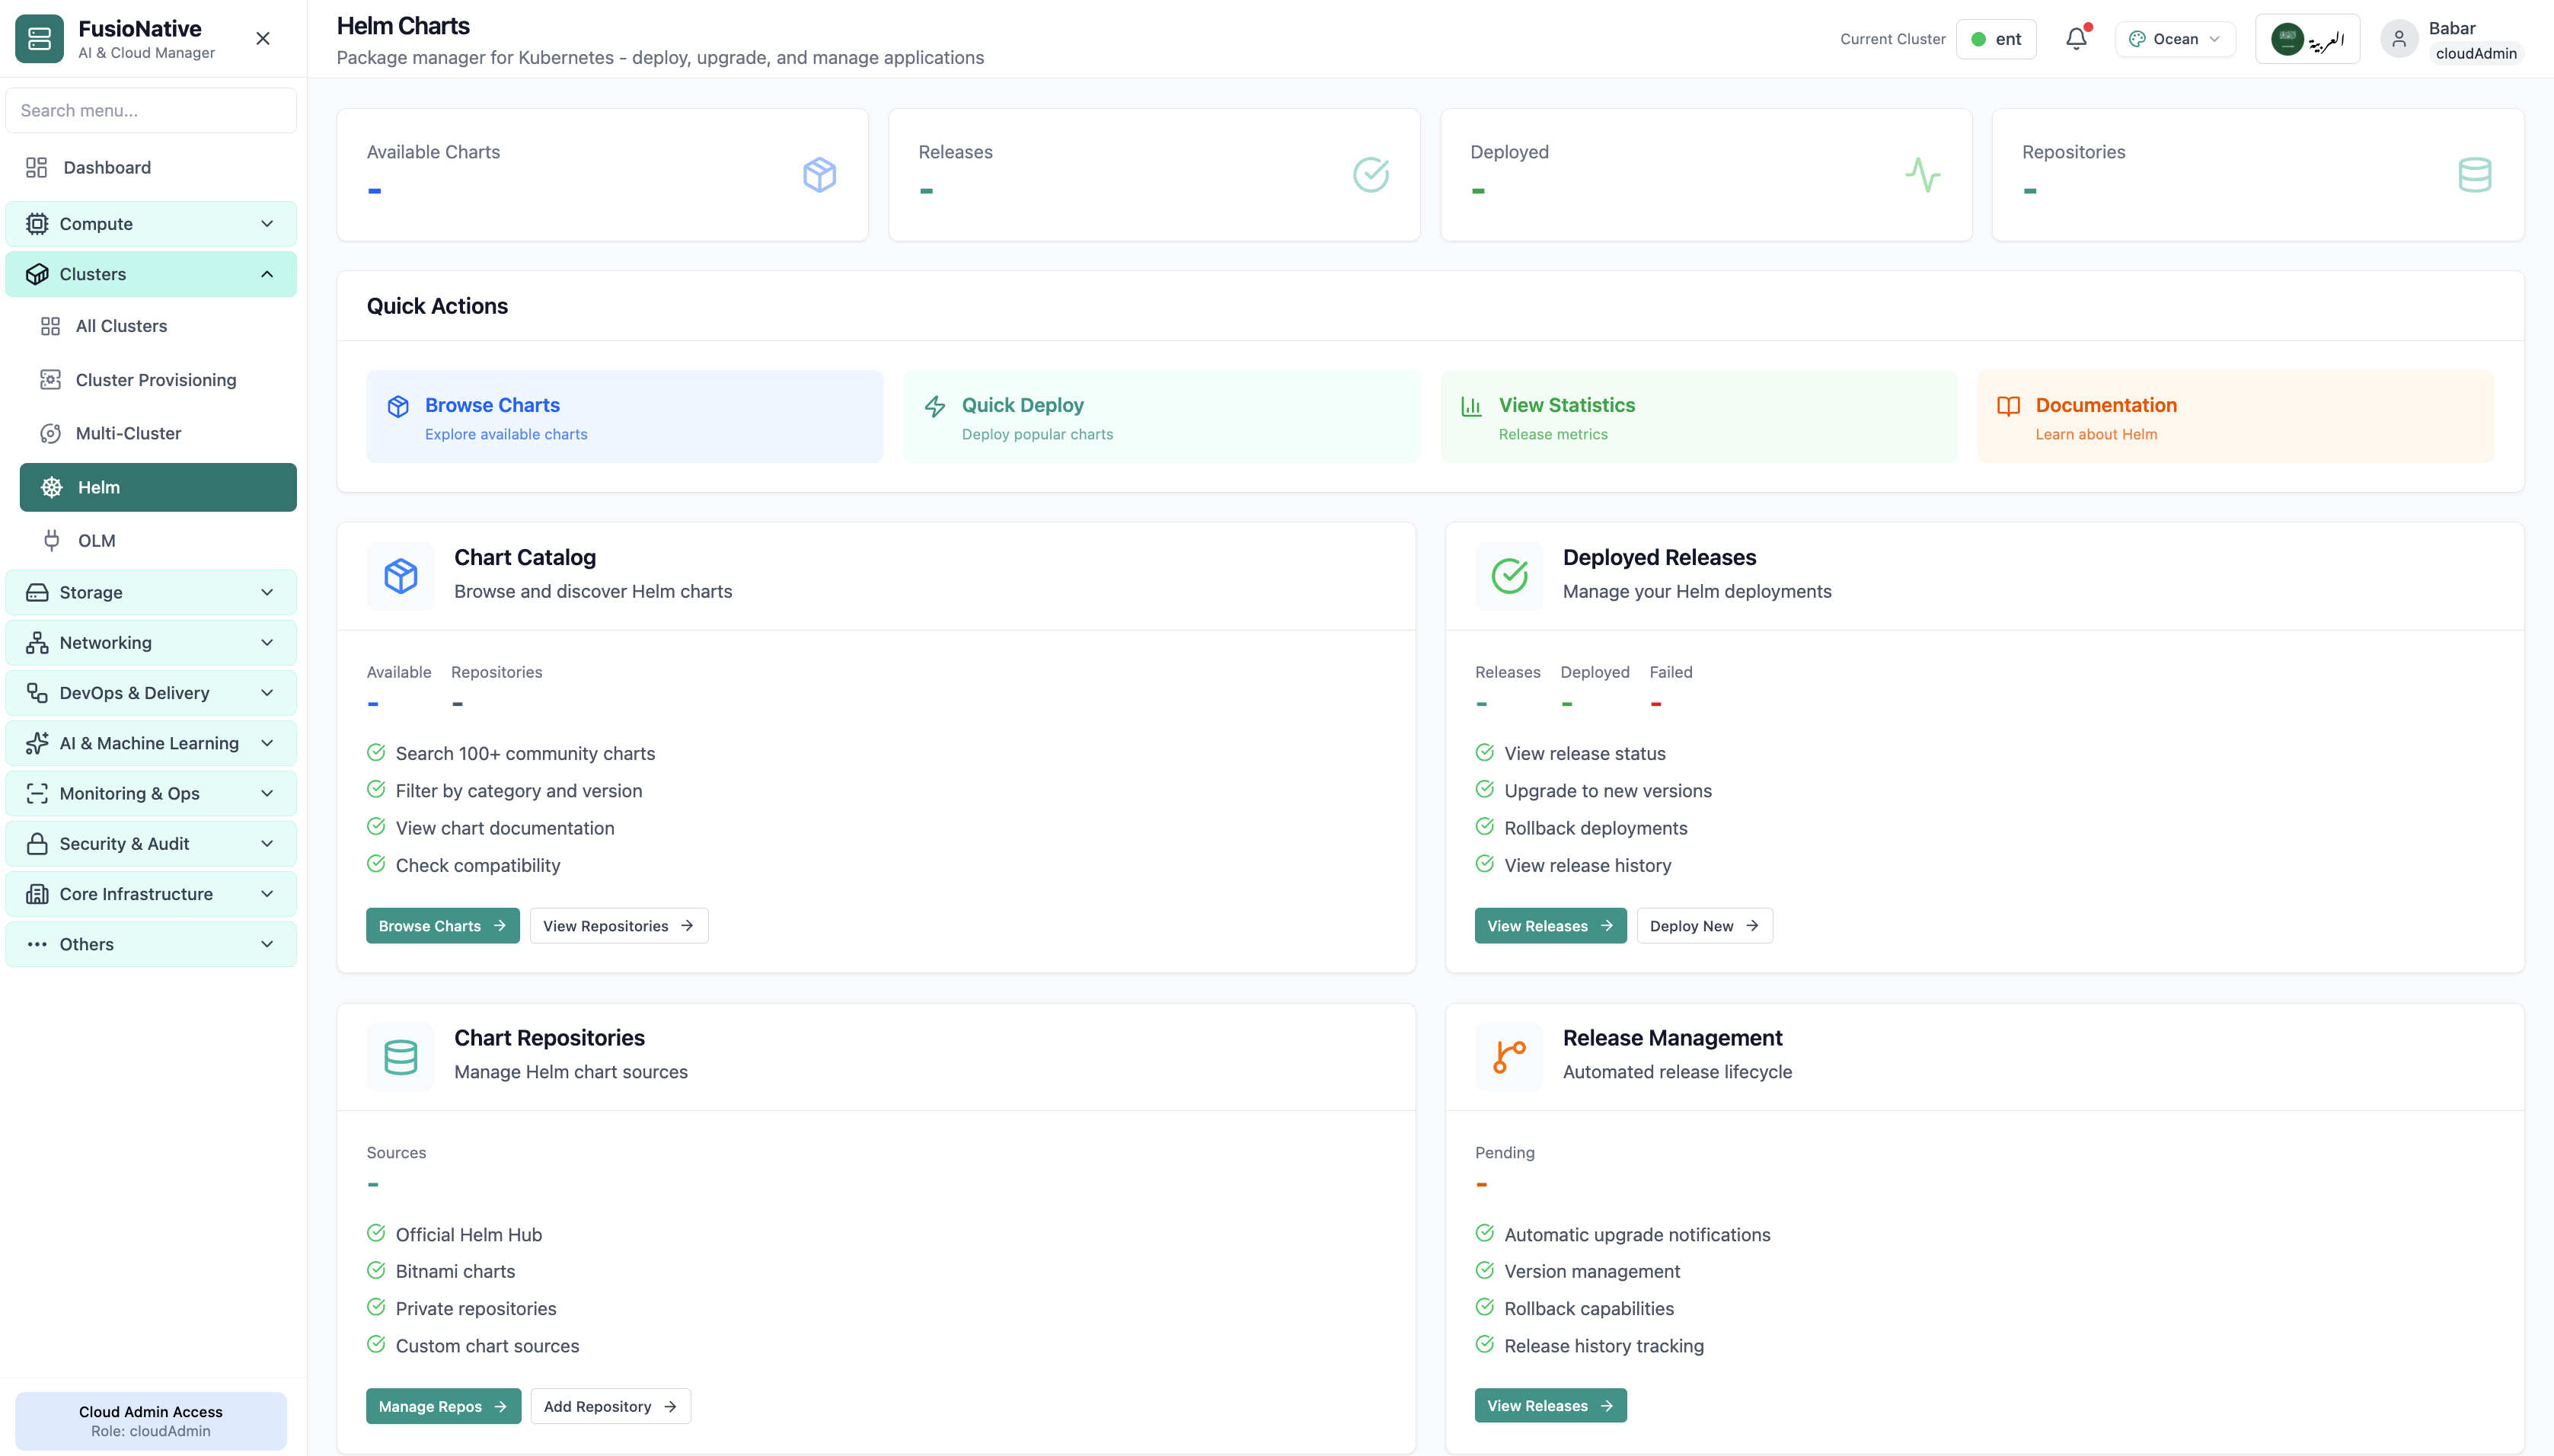
Event stream with filters—see admission failures, pulls, and scheduling issues early.
02of 03Cloud Admin

Cluster events

Event stream with filters—see admission failures, pulls, and scheduling issues early.

  • Type and reason breakdowns
  • Cluster-scoped filters
  • Faster root-cause hypotheses

Click the screenshot to open full size, zoom, and pan.
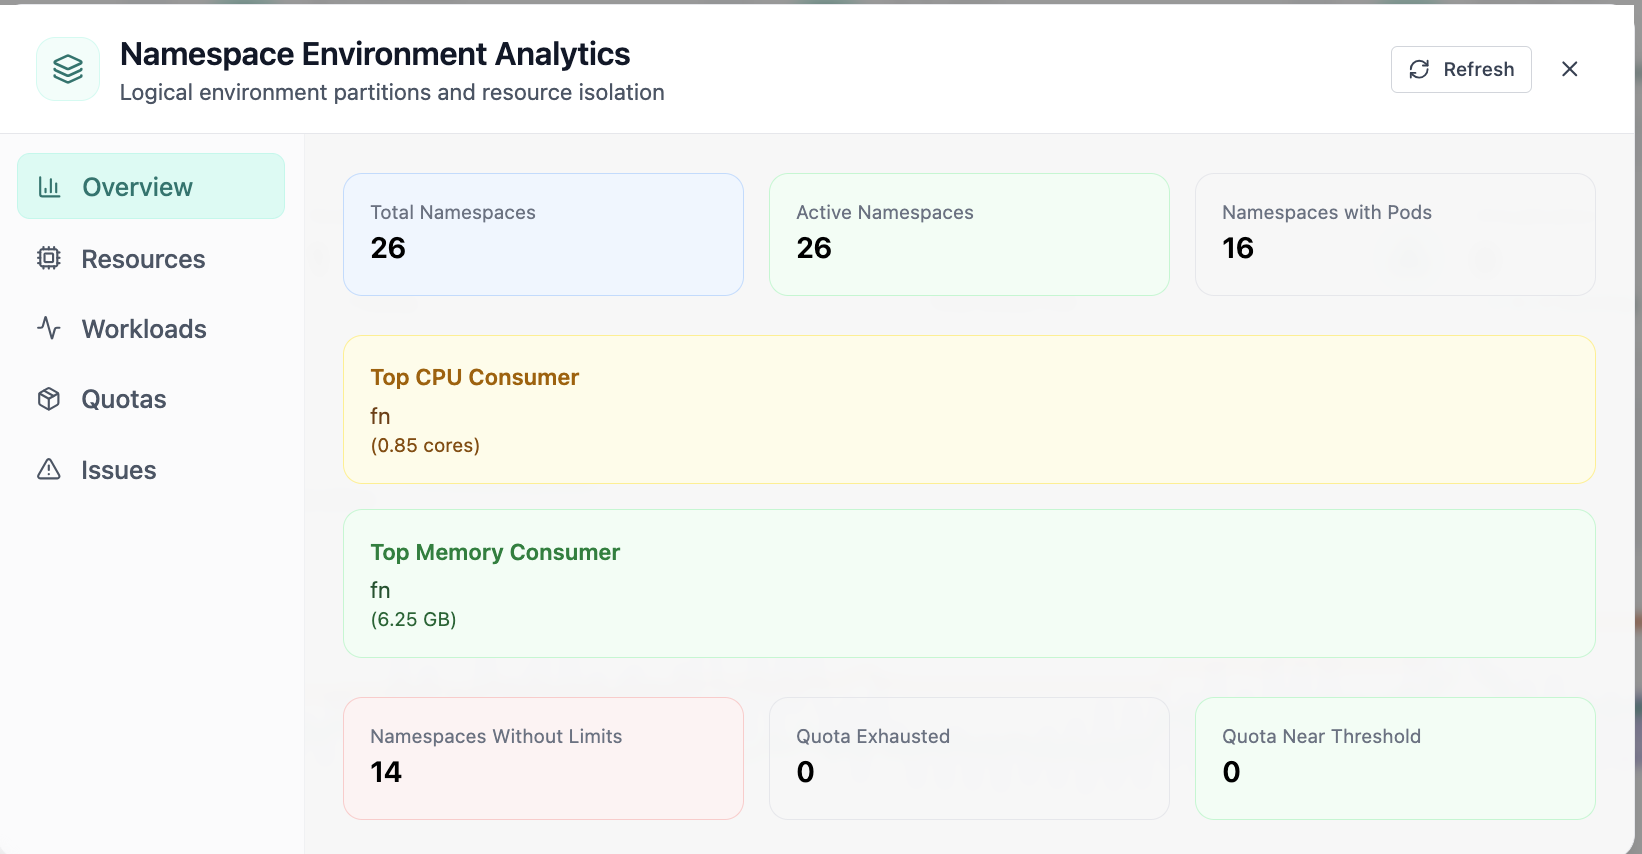
Namespace-level consumption—find noisy neighbors during saturation events.
03of 03Cloud Admin

Namespace analytics

Namespace-level consumption—find noisy neighbors during saturation events.

  • Top consumers visible
  • Quota issues surfaced
  • Same UI as fleet views

Click the screenshot to open full size, zoom, and pan.