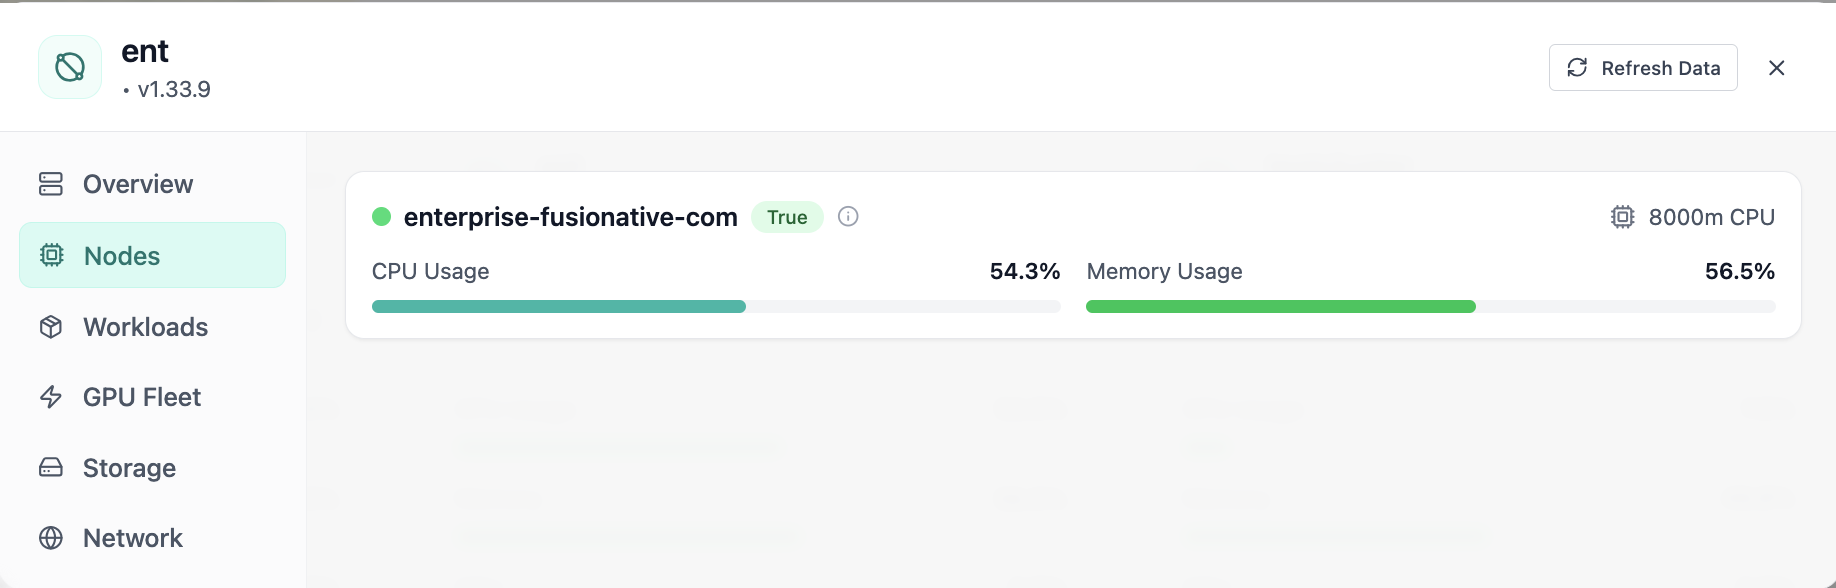
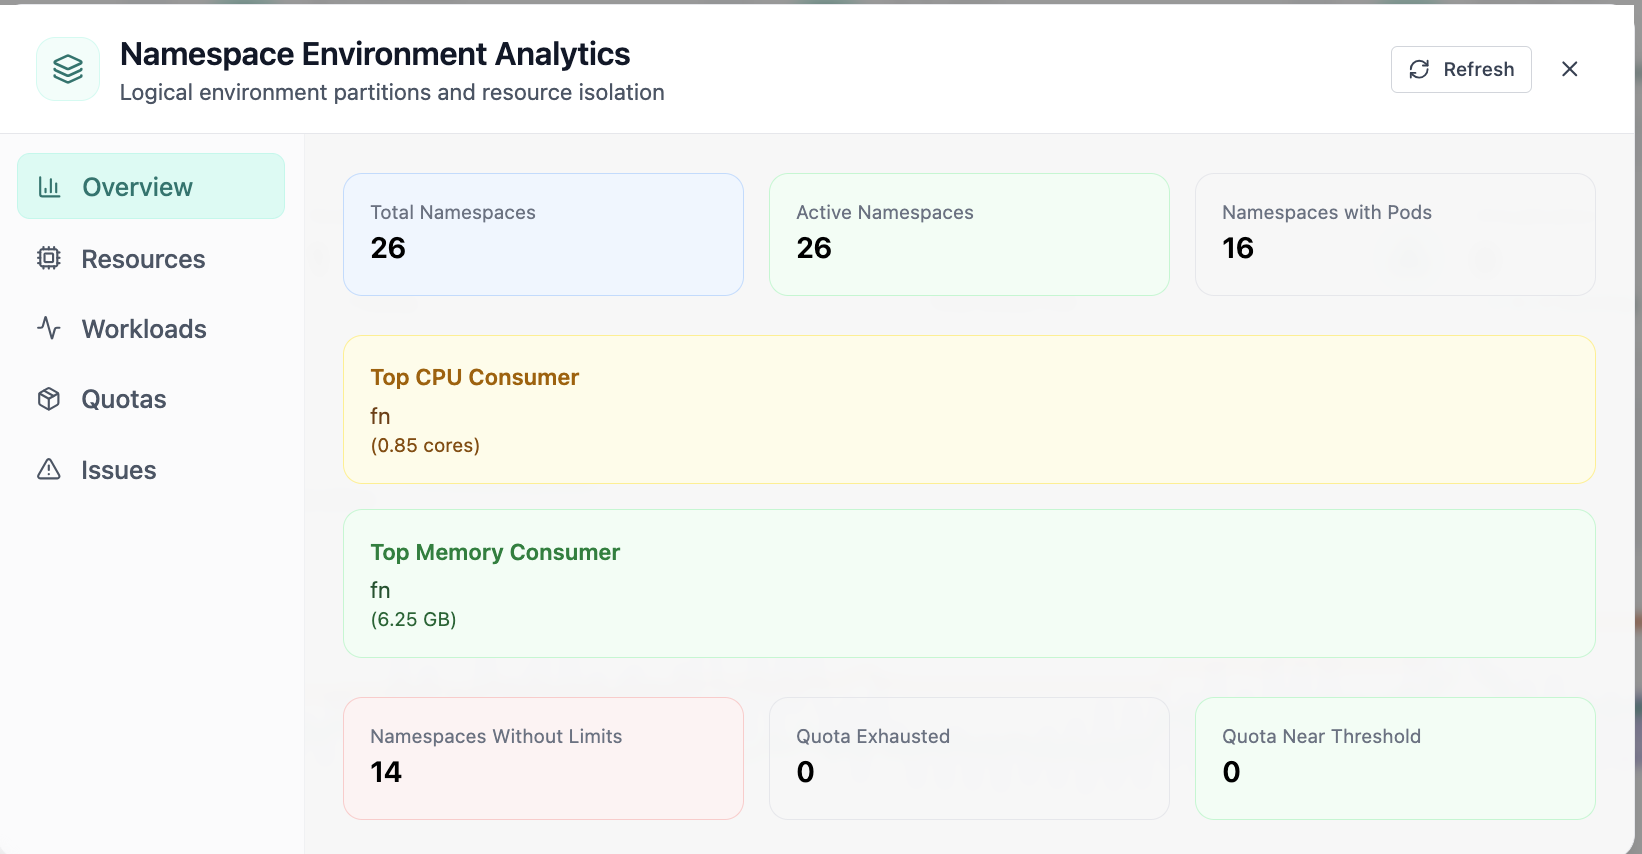
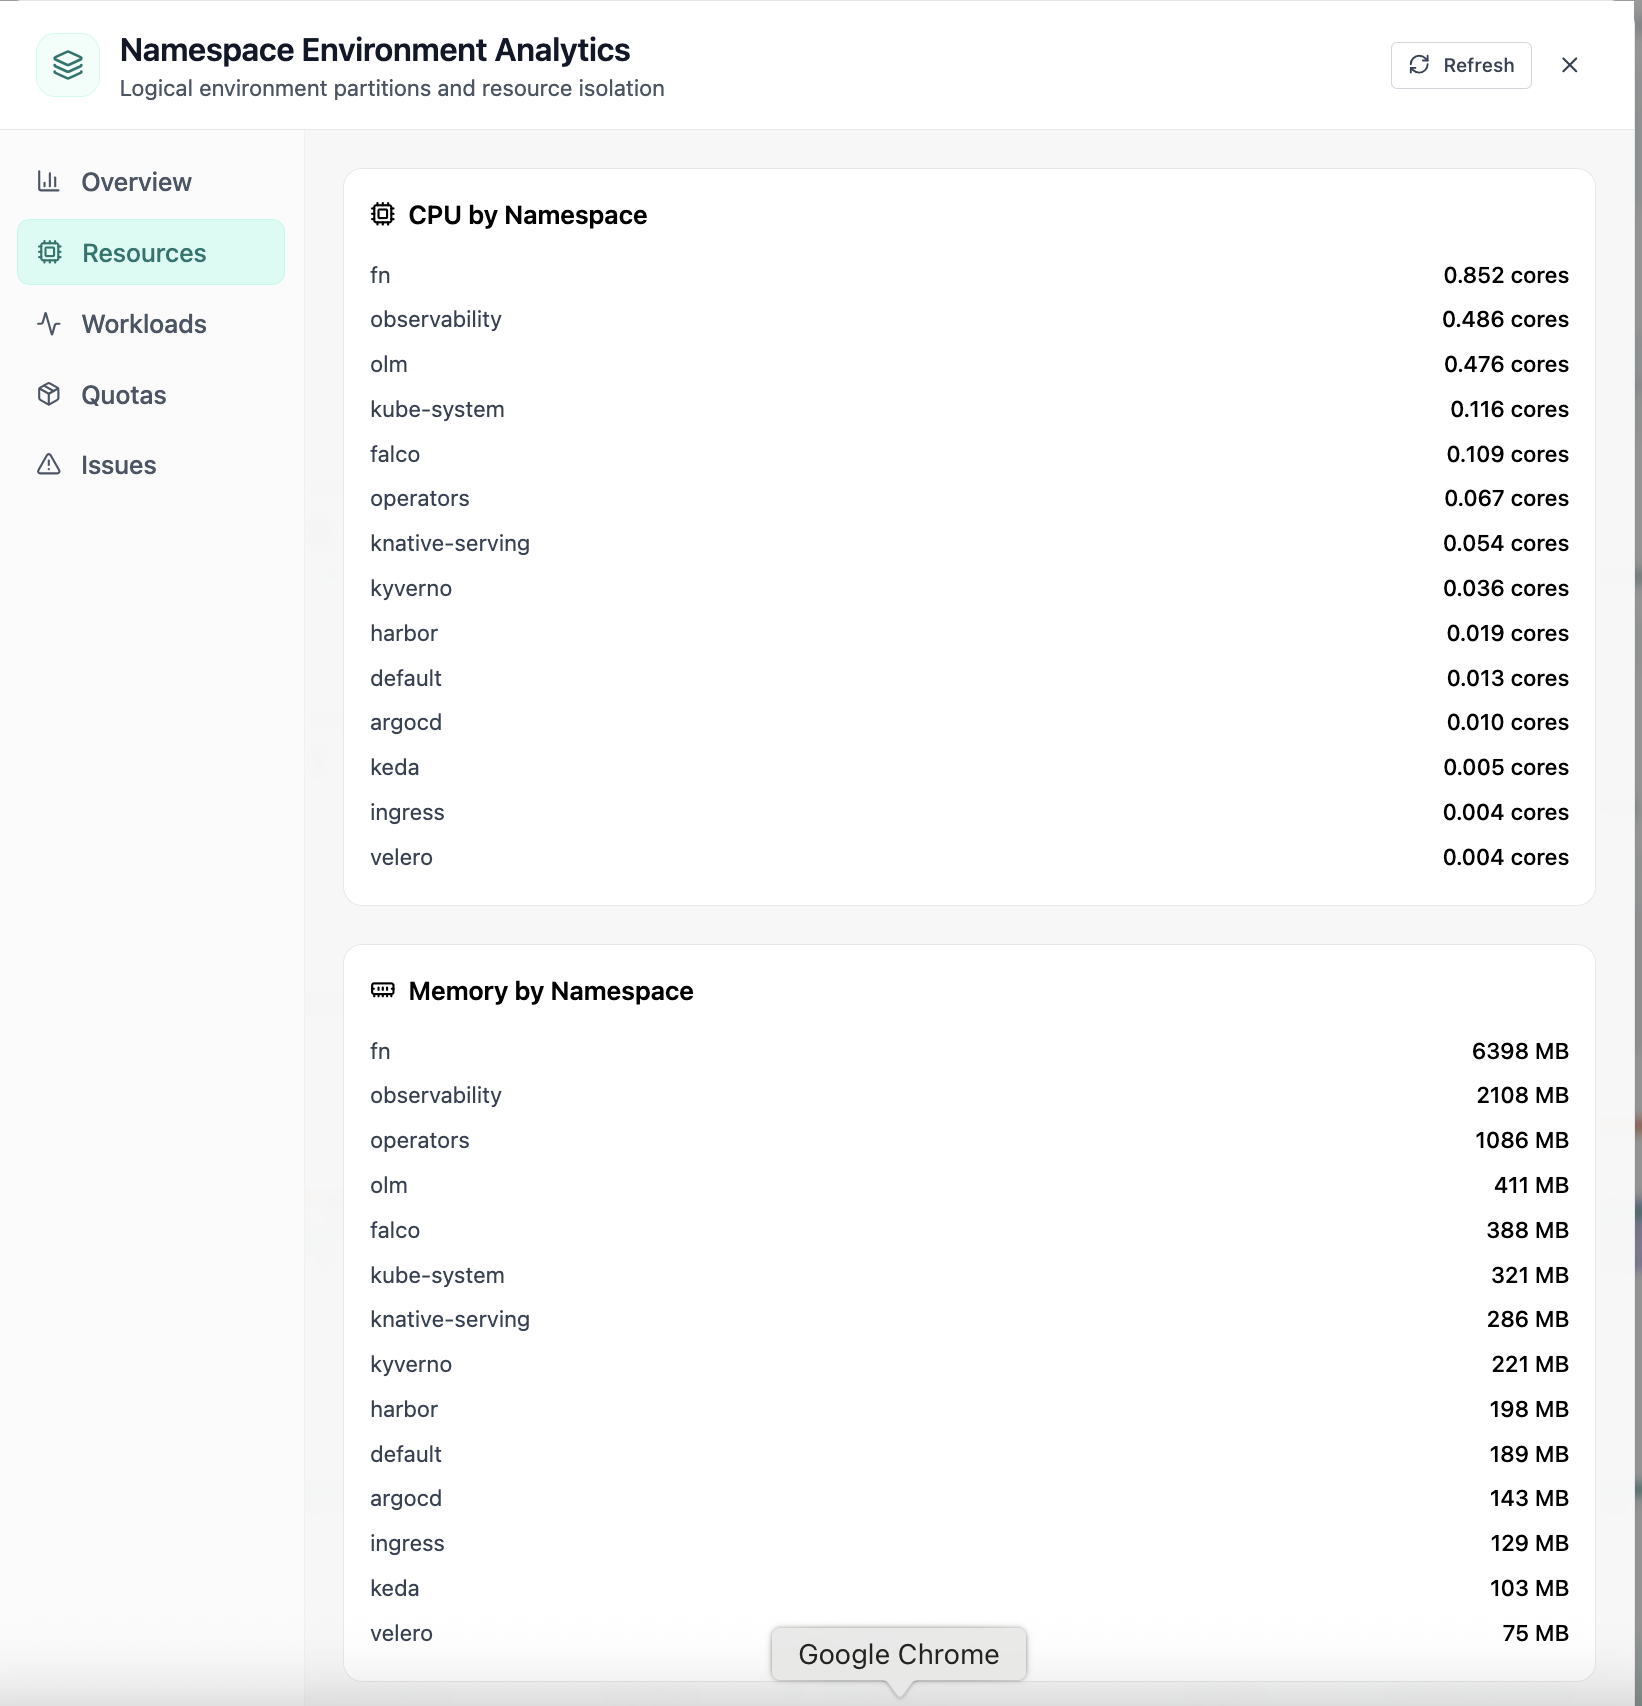
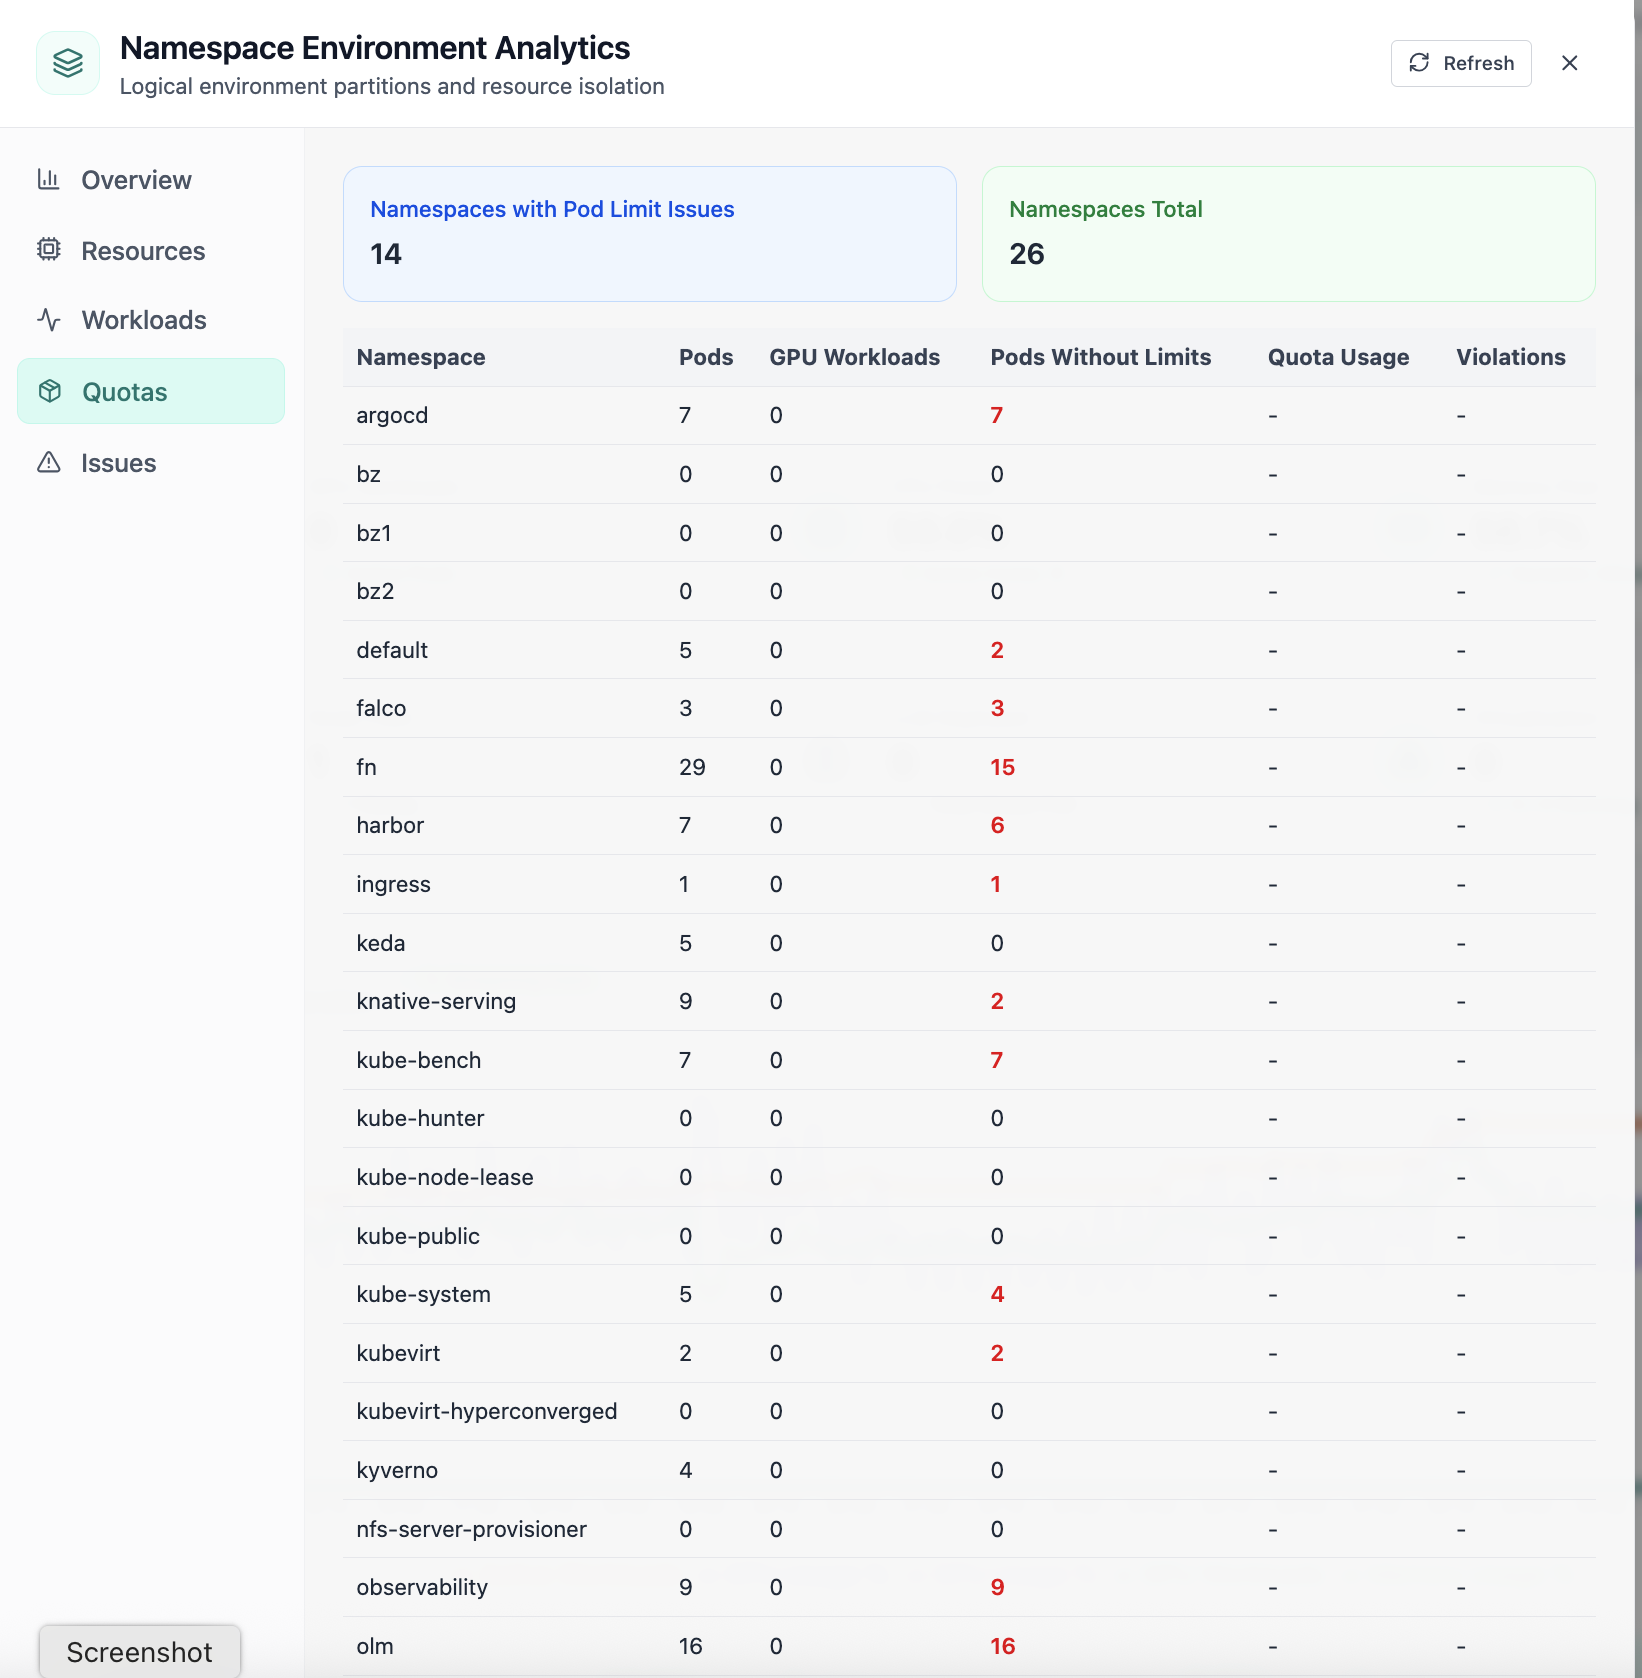
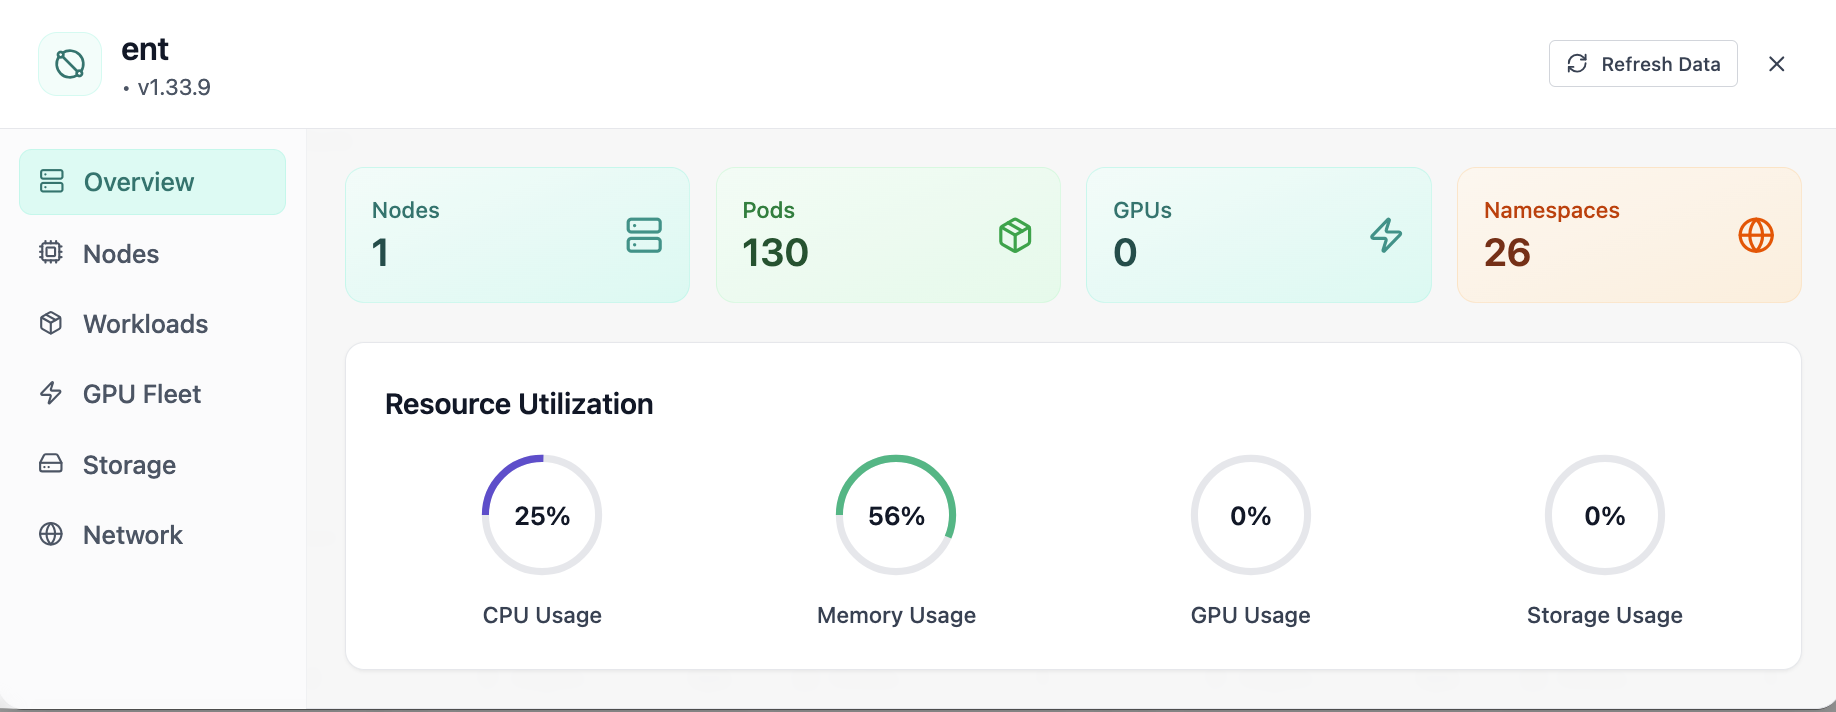
Monitoring & Ops

Cluster Resources — Kubernetes cluster dashboard

Under Monitoring & Ops → Resources (and the FN K8s Dashboard entry point), Cloud Admin shows one cluster at a glance: version and node count in the header, a KPI strip for CPU, memory, pods, namespaces, and readiness, then capacity vs usage charts and per-node cards with pod slots, CPU/memory/storage bars, and paths to details or console.

Product walkthrough

See it in Cloud Admin

Screenshots from the live product. Each note explains what you are looking at and when you would open this screen.

Cluster overview with nodes, pods, GPUs, and utilization gauges.
01 of 07 Cloud Admin

Cluster Overview

Your starting point for Kubernetes cluster operations: KPI cards and charts summarize fleet health, including cluster overview with nodes, pods, gpus, and utilization gauges. Spot drift early, then drill into the tab that explains the root cause.

  • GPU and cluster metrics on one screen
  • Charts link utilization to time so you spot spikes quickly
  • One click into deeper tabs when something looks off

Click the screenshot to open full size, zoom, and pan.

Cluster nodes view with CPU and memory usage per node.
02 of 07 Cloud Admin

Nodes

Cluster nodes view with CPU and memory usage per node. This is the same interface your team uses in production.

  • Same layout your operators see in production
  • Click to zoom in without losing detail
  • Works alongside the rest of Cloud Admin

Click the screenshot to open full size, zoom, and pan.

Namespace environment analytics overview and top consumers.
03 of 07 Cloud Admin

Namespace Analytics · Overview

In Namespace Analytics, the Overview view answers one operational question at a time—namespace environment analytics overview and top consumers. Part of Kubernetes cluster operations; use it when you need evidence before changing limits, scaling, or opening a ticket.

  • KPI strip shows the numbers leadership cares about first
  • Charts link utilization to time so you spot spikes quickly
  • One click into deeper tabs when something looks off

Click the screenshot to open full size, zoom, and pan.

CPU and memory usage by namespace.
04 of 07 Cloud Admin

Namespace · Resources

In Namespace, the Resources view answers one operational question at a time—cpu and memory usage by namespace. Part of Kubernetes cluster operations; use it when you need evidence before changing limits, scaling, or opening a ticket.

  • Same layout your operators see in production
  • Click to zoom in without losing detail
  • Works alongside the rest of Cloud Admin

Click the screenshot to open full size, zoom, and pan.

Namespace quota limits and pod limit issues.
05 of 07 Cloud Admin

Namespace · Quotas

In Namespace, the Quotas view answers one operational question at a time—namespace quota limits and pod limit issues. Part of Kubernetes cluster operations; use it when you need evidence before changing limits, scaling, or opening a ticket.

  • Per-organization limits visible to admins and tenants
  • Usage meters explain who is consuming shared capacity
  • Supports chargeback and fair-share policy conversations

Click the screenshot to open full size, zoom, and pan.

Namespaces without limits and quota violations.
06 of 07 Cloud Admin

Namespace · Issues

In Namespace, the Issues view answers one operational question at a time—namespaces without limits and quota violations. Part of Kubernetes cluster operations; use it when you need evidence before changing limits, scaling, or opening a ticket.

  • Problems ranked so the noisiest failures surface first
  • Enough context to assign an owner without opening five tools
  • Clear next step: scale, restart, patch quota, or escalate

Click the screenshot to open full size, zoom, and pan.

Kubernetes cluster dashboard with CPU, memory, pod, and node gauges.
07 of 07 Cloud Admin

Kubernetes Cluster Dashboard

Your starting point for Kubernetes cluster operations: KPI cards and charts summarize fleet health, including kubernetes cluster dashboard with cpu, memory, pod, and node gauges. Spot drift early, then drill into the tab that explains the root cause.

  • KPI strip shows the numbers leadership cares about first
  • Charts link utilization to time so you spot spikes quickly
  • One click into deeper tabs when something looks off

Click the screenshot to open full size, zoom, and pan.

From headline to node

One screen for “is the cluster healthy?” and “which node is lying?”

Cluster Resources bridges executive KPIs and SRE forensics: the same refresh cycle feeds the top strip, capacity vs usage bars, and node cards—so debates reference one dataset.

Warning thresholds baked in

Capacity charts call out when allocated share crosses policy bands—less guesswork than raw gauge colors alone.

Console when kubectl is faster

Node cards expose console access for operators who need immediate shell validation beside the charts.

Fleet-ready metadata

Version and build metadata help compare clusters during upgrades without opening vendor PDFs.